
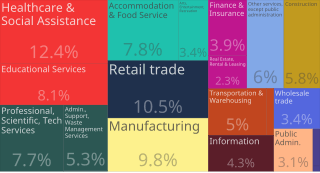
Image: Tree Map of Employment by Industries in Los Angeles County, Ca (2015)

Size of this PNG preview of this SVG file: 800 × 433 pixels. Other resolution: 320 × 173 pixels.
Original image (SVG file, nominally 905 × 490 pixels, file size: 22 KB)
Description: From 2014 to 2015, employment in Los Angeles County, CA grew at a rate of 1.83%, from 4.74M employees to 4.83M employees. The most common employment sectors for those who live in Los Angeles County, CA, are Healthcare & Social Assistance, Retail trade, and Manufacturing. This chart shows the share breakdown of the primary industries for residents of Los Angeles County, CA, though some of these residents may live in Los Angeles County, CA and work somewhere else. Census data is tagged to a residential address, not a work address.
Usage Terms: Public domain
Image usage
The following 3 pages link to this image:

All content from Kiddle encyclopedia articles (including the article images and facts) can be freely used under Attribution-ShareAlike license, unless stated otherwise.
.svg)