
Image: Cereals allocated to food, animal feed and fuel, World

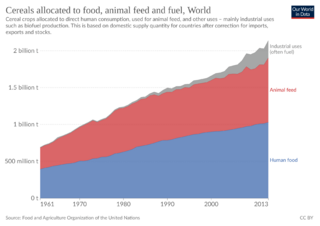
Description: It is unclear why the graph does not show data 2013-2017. "Variable description The quantity of domestic cereal supply (after trade) allocated to animal feed. Variable time span 1961 – 2017 Unit conversion factor for chart 1000 Data published by Food and Agriculture Organization of the United Nations (FAO) (2020) Link http://www.fao.org/faostat/en/?#data/ Retrieved 26th February 2020 This dataset reports the quantity of cereal crops allocated directly to human food; used as animal feed; and allocated to other uses (predominantly industrial uses such as biofuel production). The dataset combines two sets of variables: in the Food Balance Sheets the FAO include data via their ‘old methodology’ from 1961 to 2013, and ‘new methodology’ separately from 2014 to 2017. The variables included were ‘Cereals – Food’, ‘Cereals – Feed’ and ‘Cereals – Other Uses’, all measured in 1000 tonnes. We have combined these two sets of data to get a complete series from 1961 to 2017 (in tonnes). The share of cereals allocated to each use (Food, Feed and Other Uses) have also been calculated by dividing each individual variable by the sum of all three. For example: Share of cereals allocated to food = [Food / (Food + Feed + Other Uses) * 100]. This calculates the share of cereals available domestically (after trade) allocated to each use, excluding supply chain losses and seed resown from the crop."
Title: Cereals allocated to food, animal feed and fuel, World
Credit: https://ourworldindata.org/grapher/cereal-distribution-to-uses
Author: OurWorldInData, based on data by Food and Agriculture Organization of the United Nations (FAO) (2020) http://www.fao.org/faostat/en/?#data/
Usage Terms: Creative Commons Attribution 4.0
License: CC BY 4.0
License Link: https://creativecommons.org/licenses/by/4.0
Attribution Required?: Yes
Image usage
The following page links to this image:
