
Image: Shale color chart

Size of this preview: 776 × 600 pixels. Other resolutions: 311 × 240 pixels | 1,056 × 816 pixels.
Original image (1,056 × 816 pixels, file size: 13 KB, MIME type: image/png)
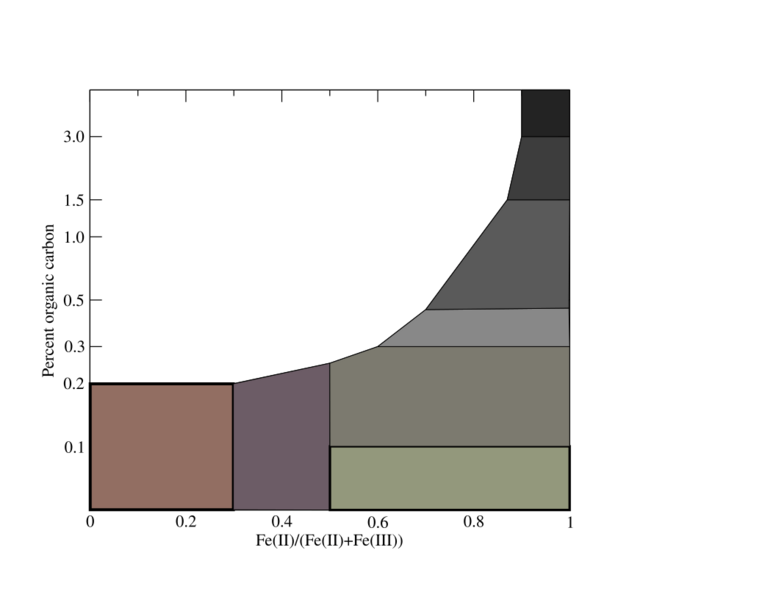
Description: This diagram shows the approximate color of shale of varying oxidation state and organic carbon content. The oxidation state is expressed as the mole fraction of ferrous iron to total iron. The region at upper left represents compositions unlikely to be found in nature. Based on Potter, Maynard, and Pryor (1980). Sedimentology of shale : study guide and reference source. New York: Springer-Verlag. ISBN 0387904301.
Title: Shale color chart
Credit: Own work
Author: Kent G. Budge
Usage Terms: Creative Commons Zero, Public Domain Dedication
License: CC0
License Link: http://creativecommons.org/publicdomain/zero/1.0/deed.en
Attribution Required?: No
Image usage
The following page links to this image:

All content from Kiddle encyclopedia articles (including the article images and facts) can be freely used under Attribution-ShareAlike license, unless stated otherwise.