
Image: 1973-75 recession
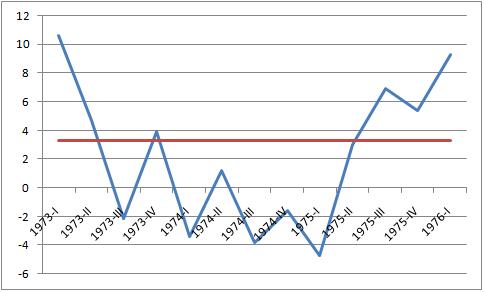
Description: A graph of the recession in the United States from 1973-75. Blue line is Percent Change From Preceding Period in Real Gross Domestic Product (annualized; seasonally adjusted) Red line is Average GDP growth 1947–2009 Data is from the Bureau of Economic Analysis.
Title: 1973-75 recession
Credit: Own work
Author: JayHenry
Permission: I, the copyright holder of this work, release this work into the public domain. This applies worldwide. In some countries this may not be legally possible; if so: I grant anyone the right to use this work for any purpose, without any conditions, unless such conditions are required by law.
Usage Terms: Public domain
License: Public domain
Attribution Required?: No
Image usage
The following 3 pages link to this image:
