
Image: 1976 Pacific hurricane season map
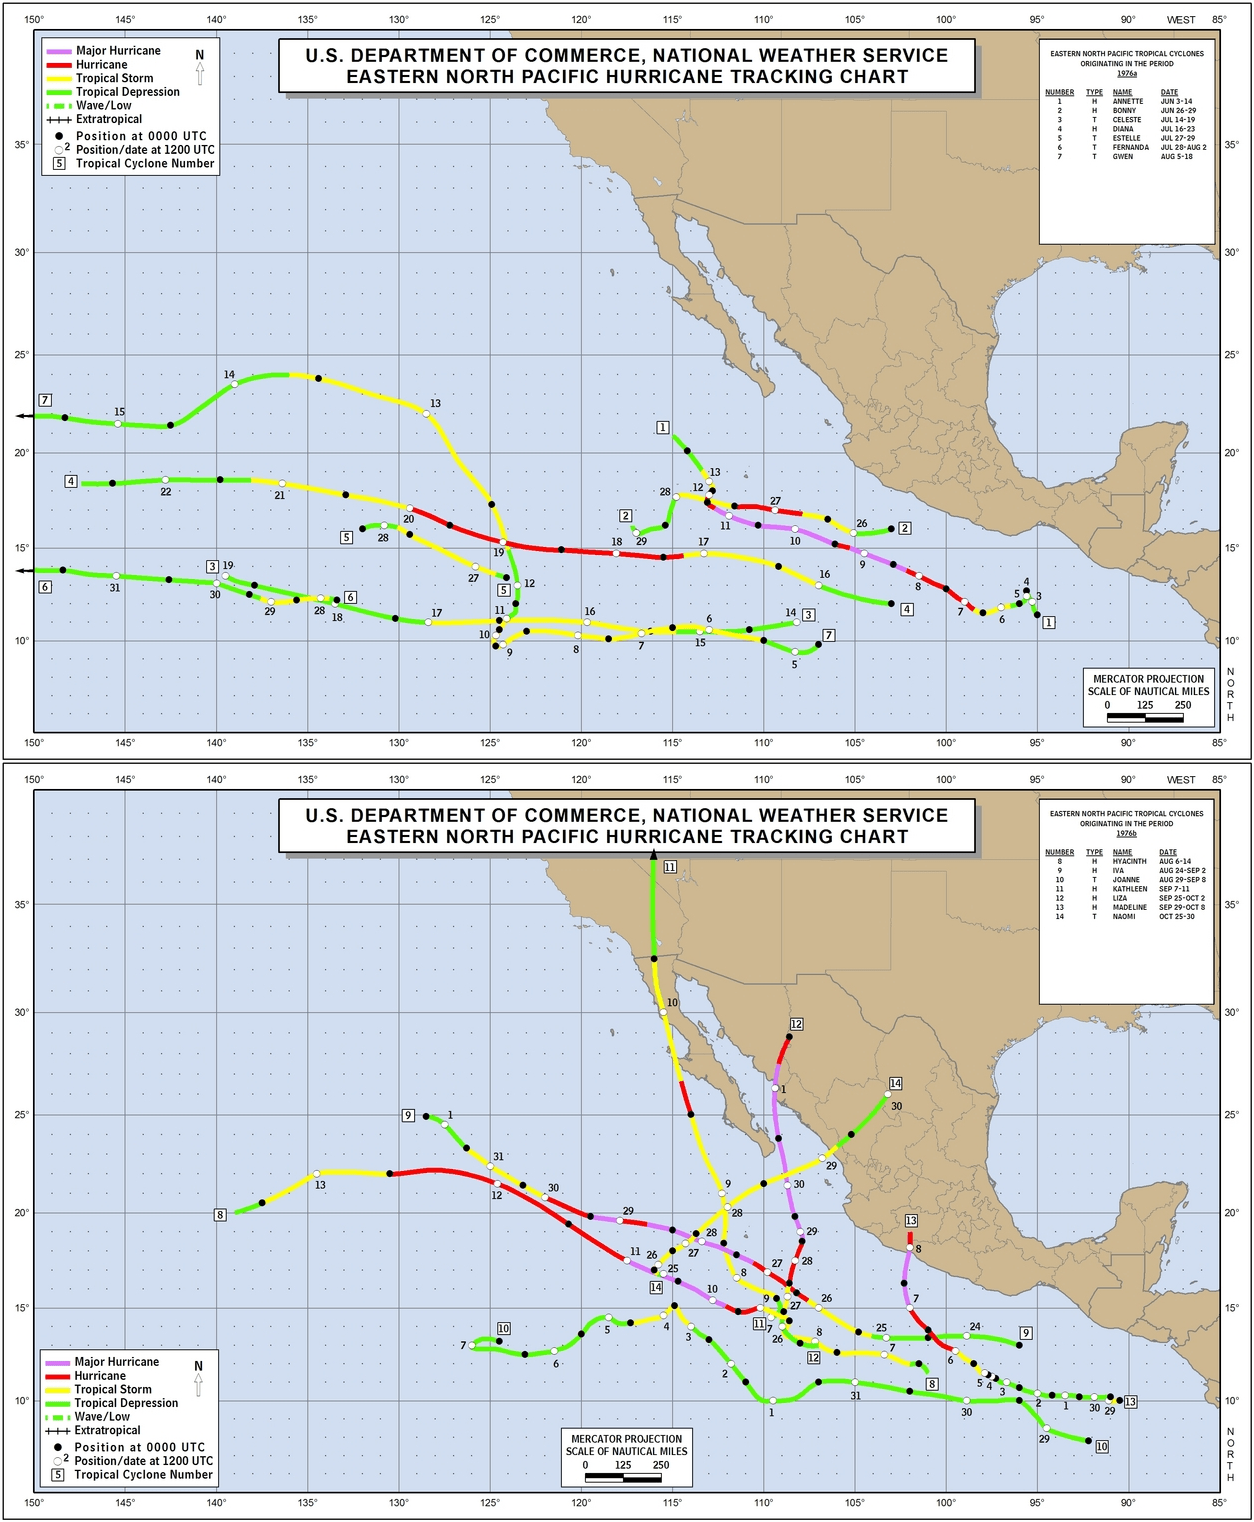
Description: This map shows the tracks of all tropical cyclones in the 1976 Pacific hurricane season. The points show the location of each storm at 6-hour intervals. The colour represents the storm's maximum sustained wind speeds as classified in the Saffir-Simpson Hurricane Scale (see below), and the shape of the data points represent the type of the storm.
Title: 1976 Pacific hurricane season map
Credit: Created using WikiProject Tropical cyclones/Tracks. The background image is from NASA [1]. The tracking data is from the National Hurricane Center and the Central Pacific Hurricane Center's Northeast and North Central Pacific hurricane database
Usage Terms: Public domain
License: Public domain
Attribution Required?: No
Image usage
There are no pages that link to this image.
