
Image: 1995HeatWaveChicago
No higher resolution available.
1995HeatWaveChicago.png (432 × 288 pixels, file size: 19 KB, MIME type: image/png)
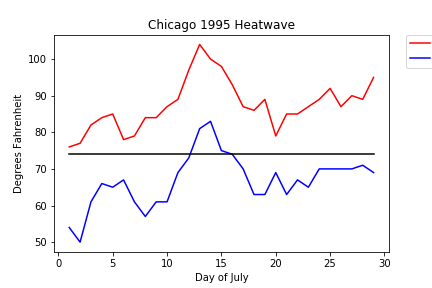
Description: Plotted observed temperatures from O'Hare International Airport. Red Lines are daily max temperatures, Blue Lines are daily minimum temperatures, and the Black Line is the July 1960-2016 mean temperature.
Title: 1995HeatWaveChicago
Credit: Own work
Author: Robertson713325
Usage Terms: Creative Commons Attribution-Share Alike 4.0
License: CC BY-SA 4.0
License Link: https://creativecommons.org/licenses/by-sa/4.0
Attribution Required?: Yes
Image usage
The following page links to this image:

All content from Kiddle encyclopedia articles (including the article images and facts) can be freely used under Attribution-ShareAlike license, unless stated otherwise.