
Image: 2005 North Indian Ocean cyclone season summary
Size of this preview: 800 × 510 pixels. Other resolutions: 320 × 204 pixels | 3,000 × 1,913 pixels.
Original image (3,000 × 1,913 pixels, file size: 552 KB, MIME type: image/jpeg)
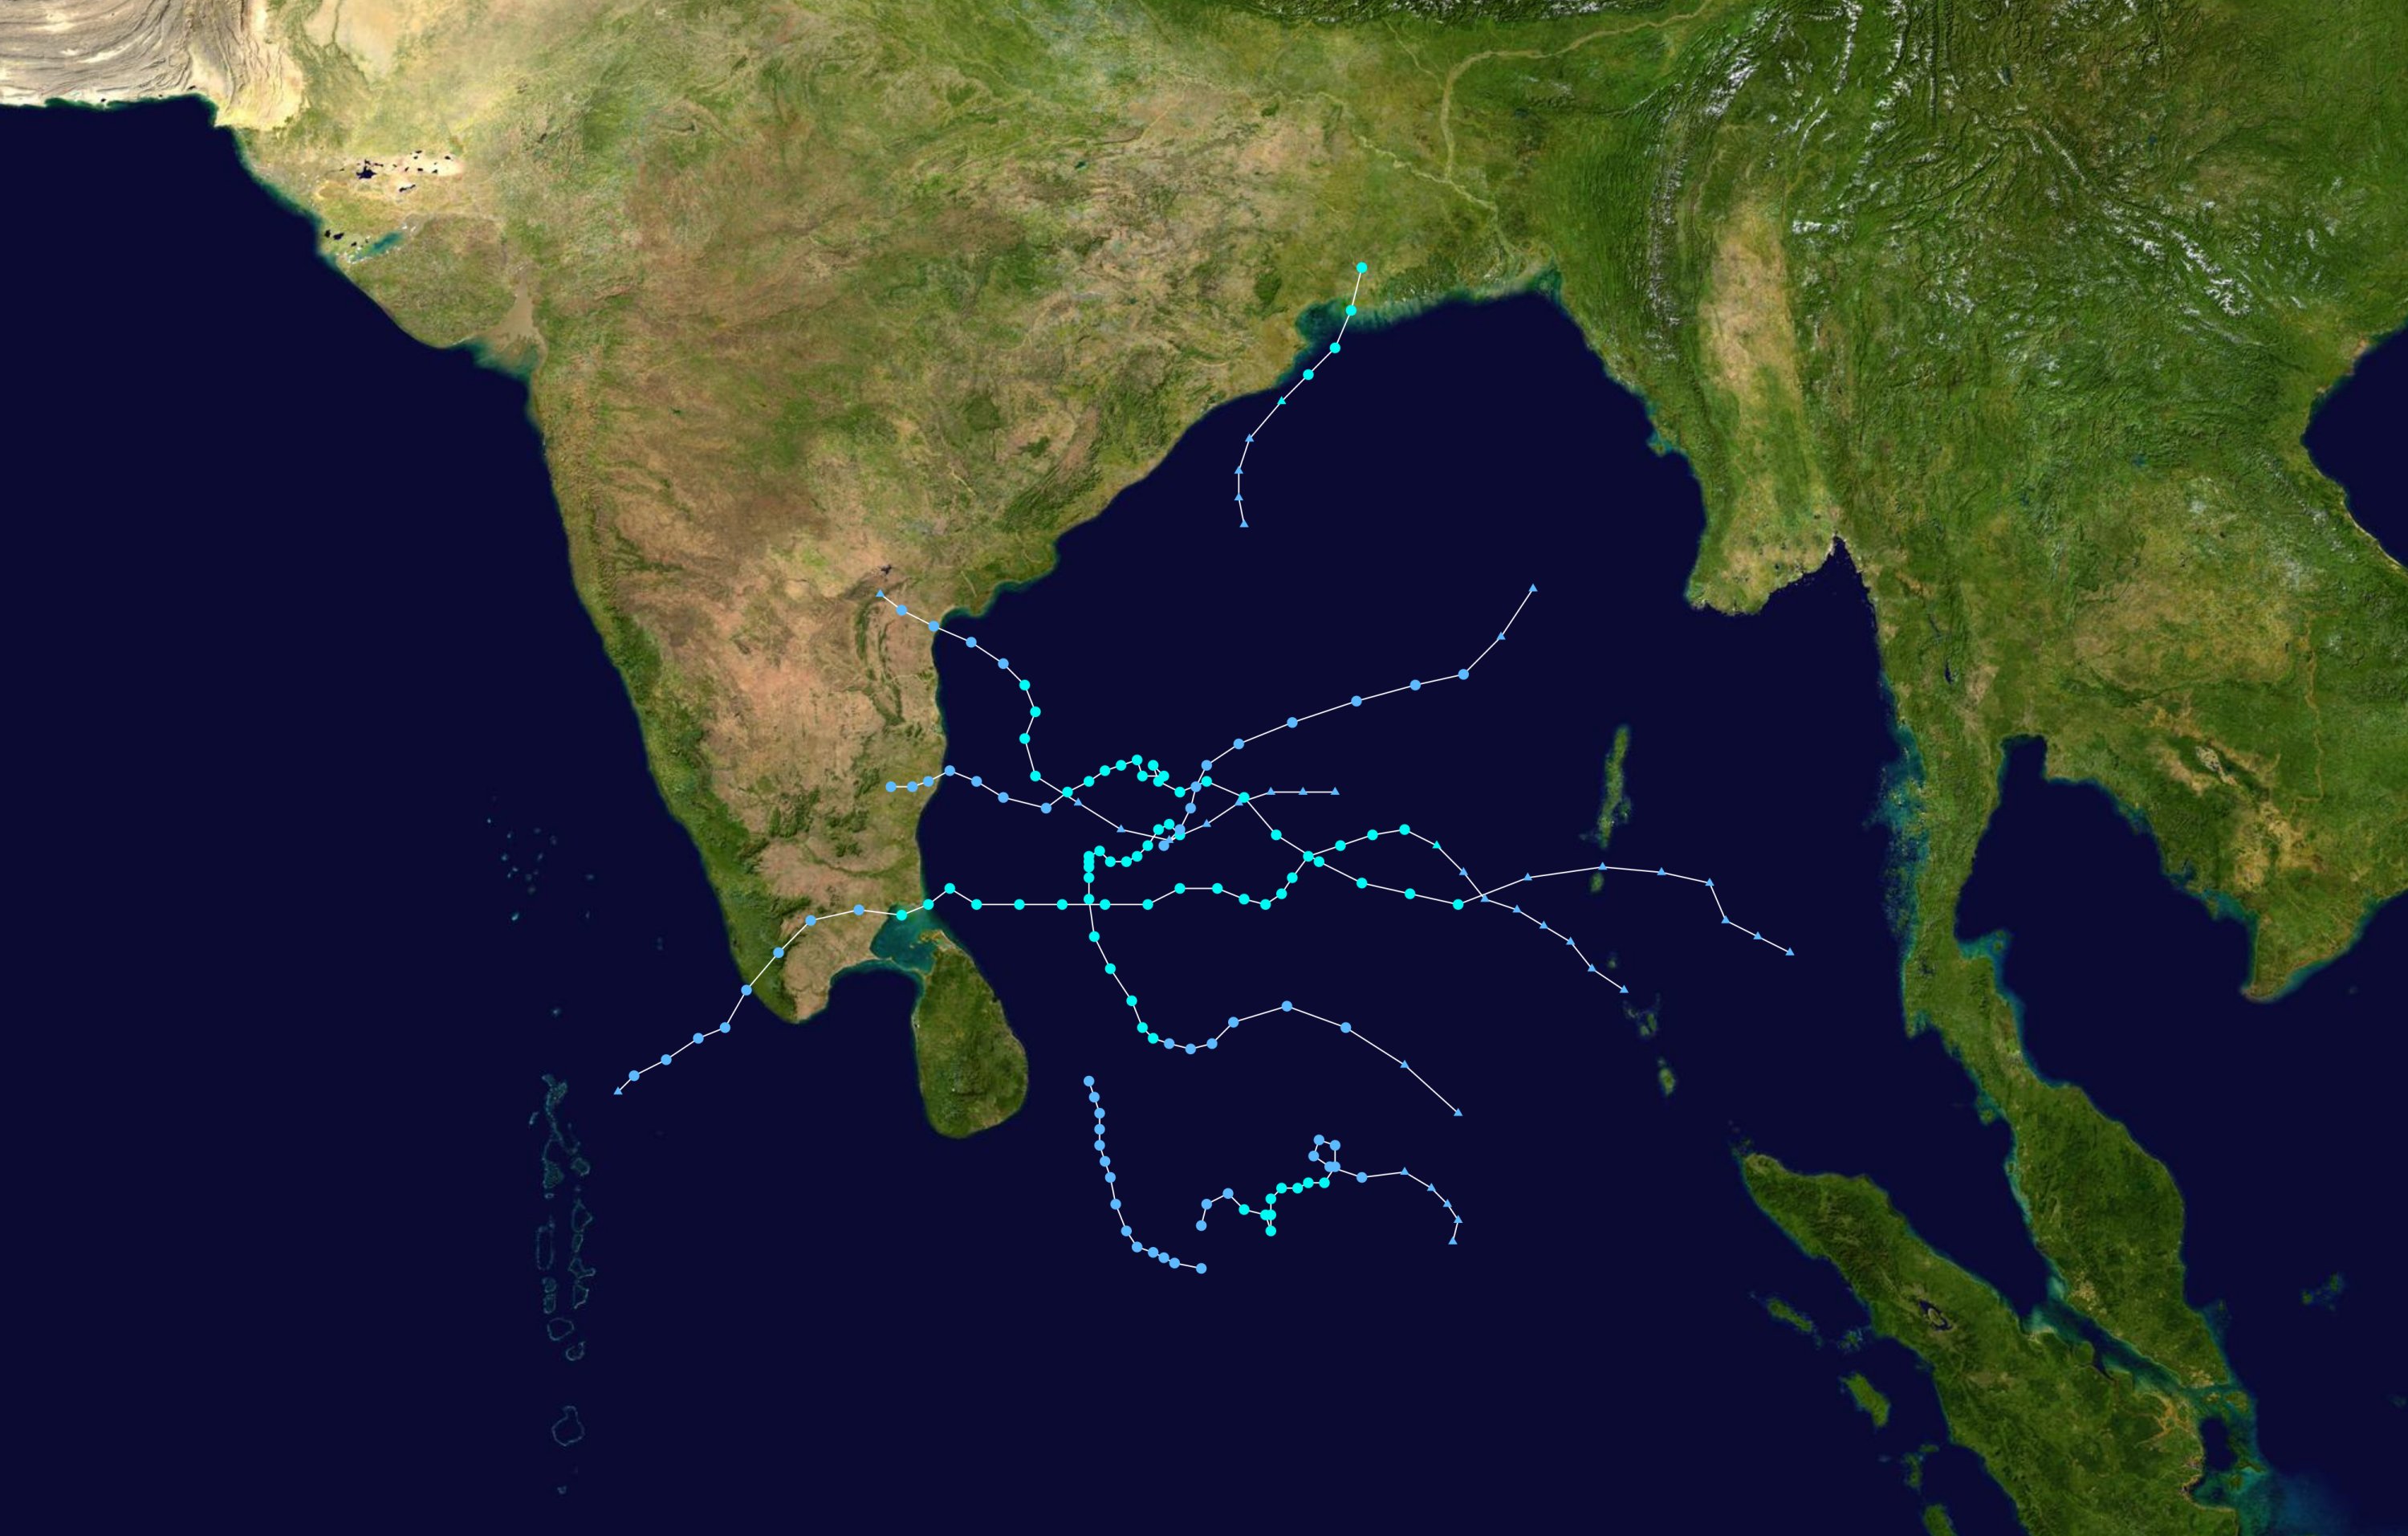
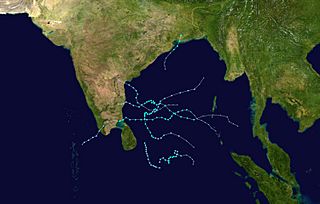
Description: This map shows the tracks of all tropical cyclones in the 2005 North Indian Ocean cyclone season. The points show the location of each storm at 6-hour intervals. The colour represents the storm's maximum sustained wind speeds as classified in the Saffir-Simpson Hurricane Scale (see below), and the shape of the data points represent the type of the storm.
Title: 2005 North Indian Ocean cyclone season summary
Credit: Created using WikiProject Tropical cyclones/Tracks. The background image is from NASA [1]. The tracking data is from the Joint Typhoon Warning Center's best track database
Author: Nilfanion
Usage Terms: Public domain
License: Public domain
Attribution Required?: No
Image usage
The following page links to this image:

All content from Kiddle encyclopedia articles (including the article images and facts) can be freely used under Attribution-ShareAlike license, unless stated otherwise.