
Image: 2005chestnut
Size of this preview: 800 × 351 pixels. Other resolutions: 320 × 140 pixels | 1,425 × 625 pixels.
Original image (1,425 × 625 pixels, file size: 57 KB, MIME type: image/png)
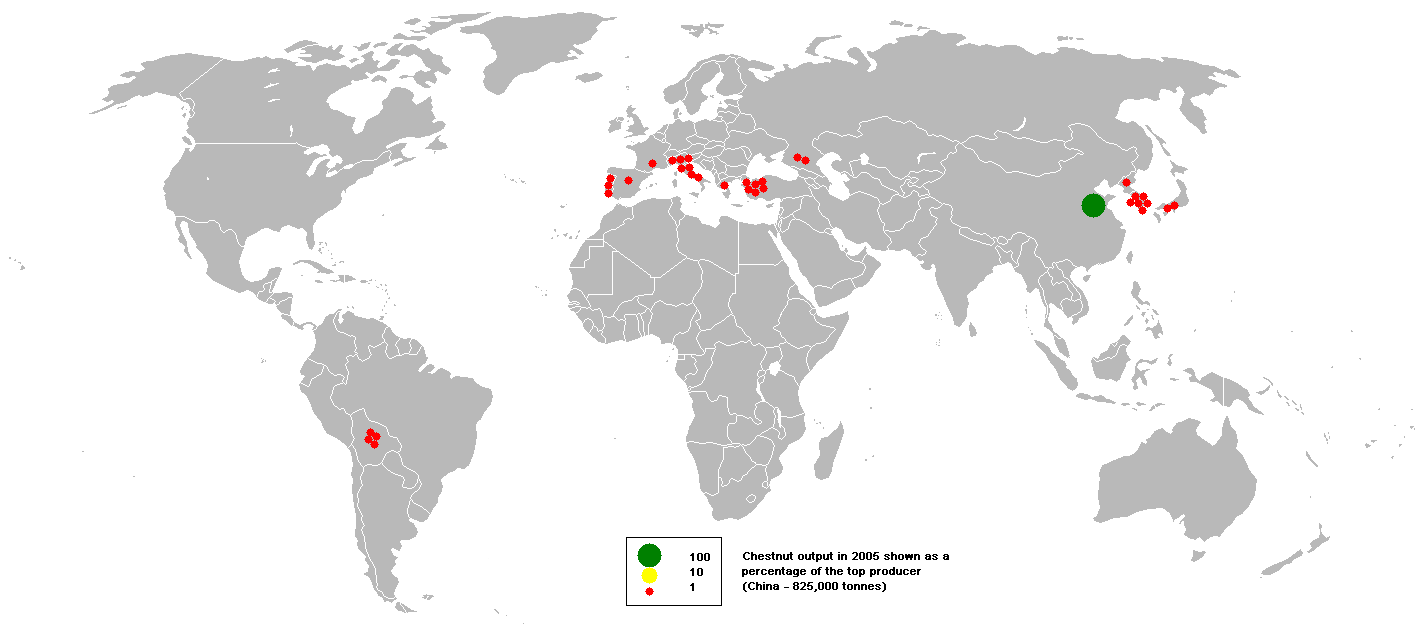
Description: This bubble map shows the global distribution of chestnut output in 2005 as a percentage of the top producer (China - 825,000 tonnes). This map is consistent with incomplete set of data too as long as the top producer is known. It resolves the accessibility issues faced by colour-coded maps that may not be properly rendered in old computer screens.
Data was extracted on 9th June 2007 from http://faostat.fao.org/site/336/DesktopDefault.aspx?PageID=336
Based on :Image:BlankMap-World.png
Usage Terms: Public domain
Image usage
The following page links to this image:

All content from Kiddle encyclopedia articles (including the article images and facts) can be freely used under Attribution-ShareAlike license, unless stated otherwise.