
Image: 2005grapefruit and pomelo

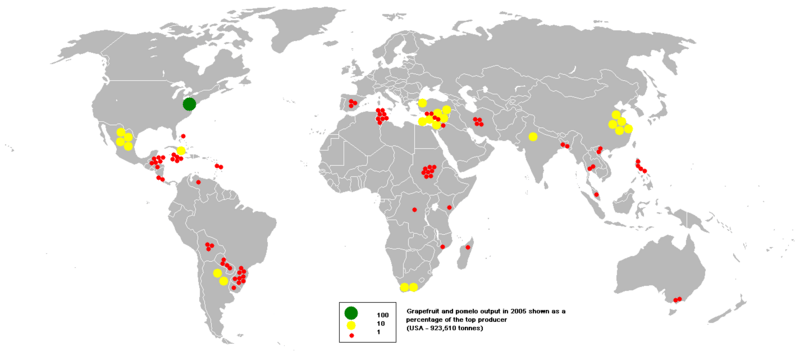
Description: This bubble map shows the global distribution of grapefruit and pomelo output in 2005 as a percentage of the top producer (USA - 923,510 tonnes). This map is consistent with incomplete set of data too as long as the top producer is known. It resolves the accessibility issues faced by colour-coded maps that may not be properly rendered in old computer screens. Data was extracted on 18th June 2007 from http://faostat.fao.org/site/336/DesktopDefault.aspx?PageID=336 Based on :Image:BlankMap-World.png
Title: 2005grapefruit and pomelo
Credit: Transferred from en.wikipedia to Commons.
Author: Anwar saadat at English Wikipedia
Usage Terms: Public domain
License: Public domain
Attribution Required?: No
Image usage
There are no pages that link to this image.
