
Image: 2020 North Indian Ocean cyclone season summary
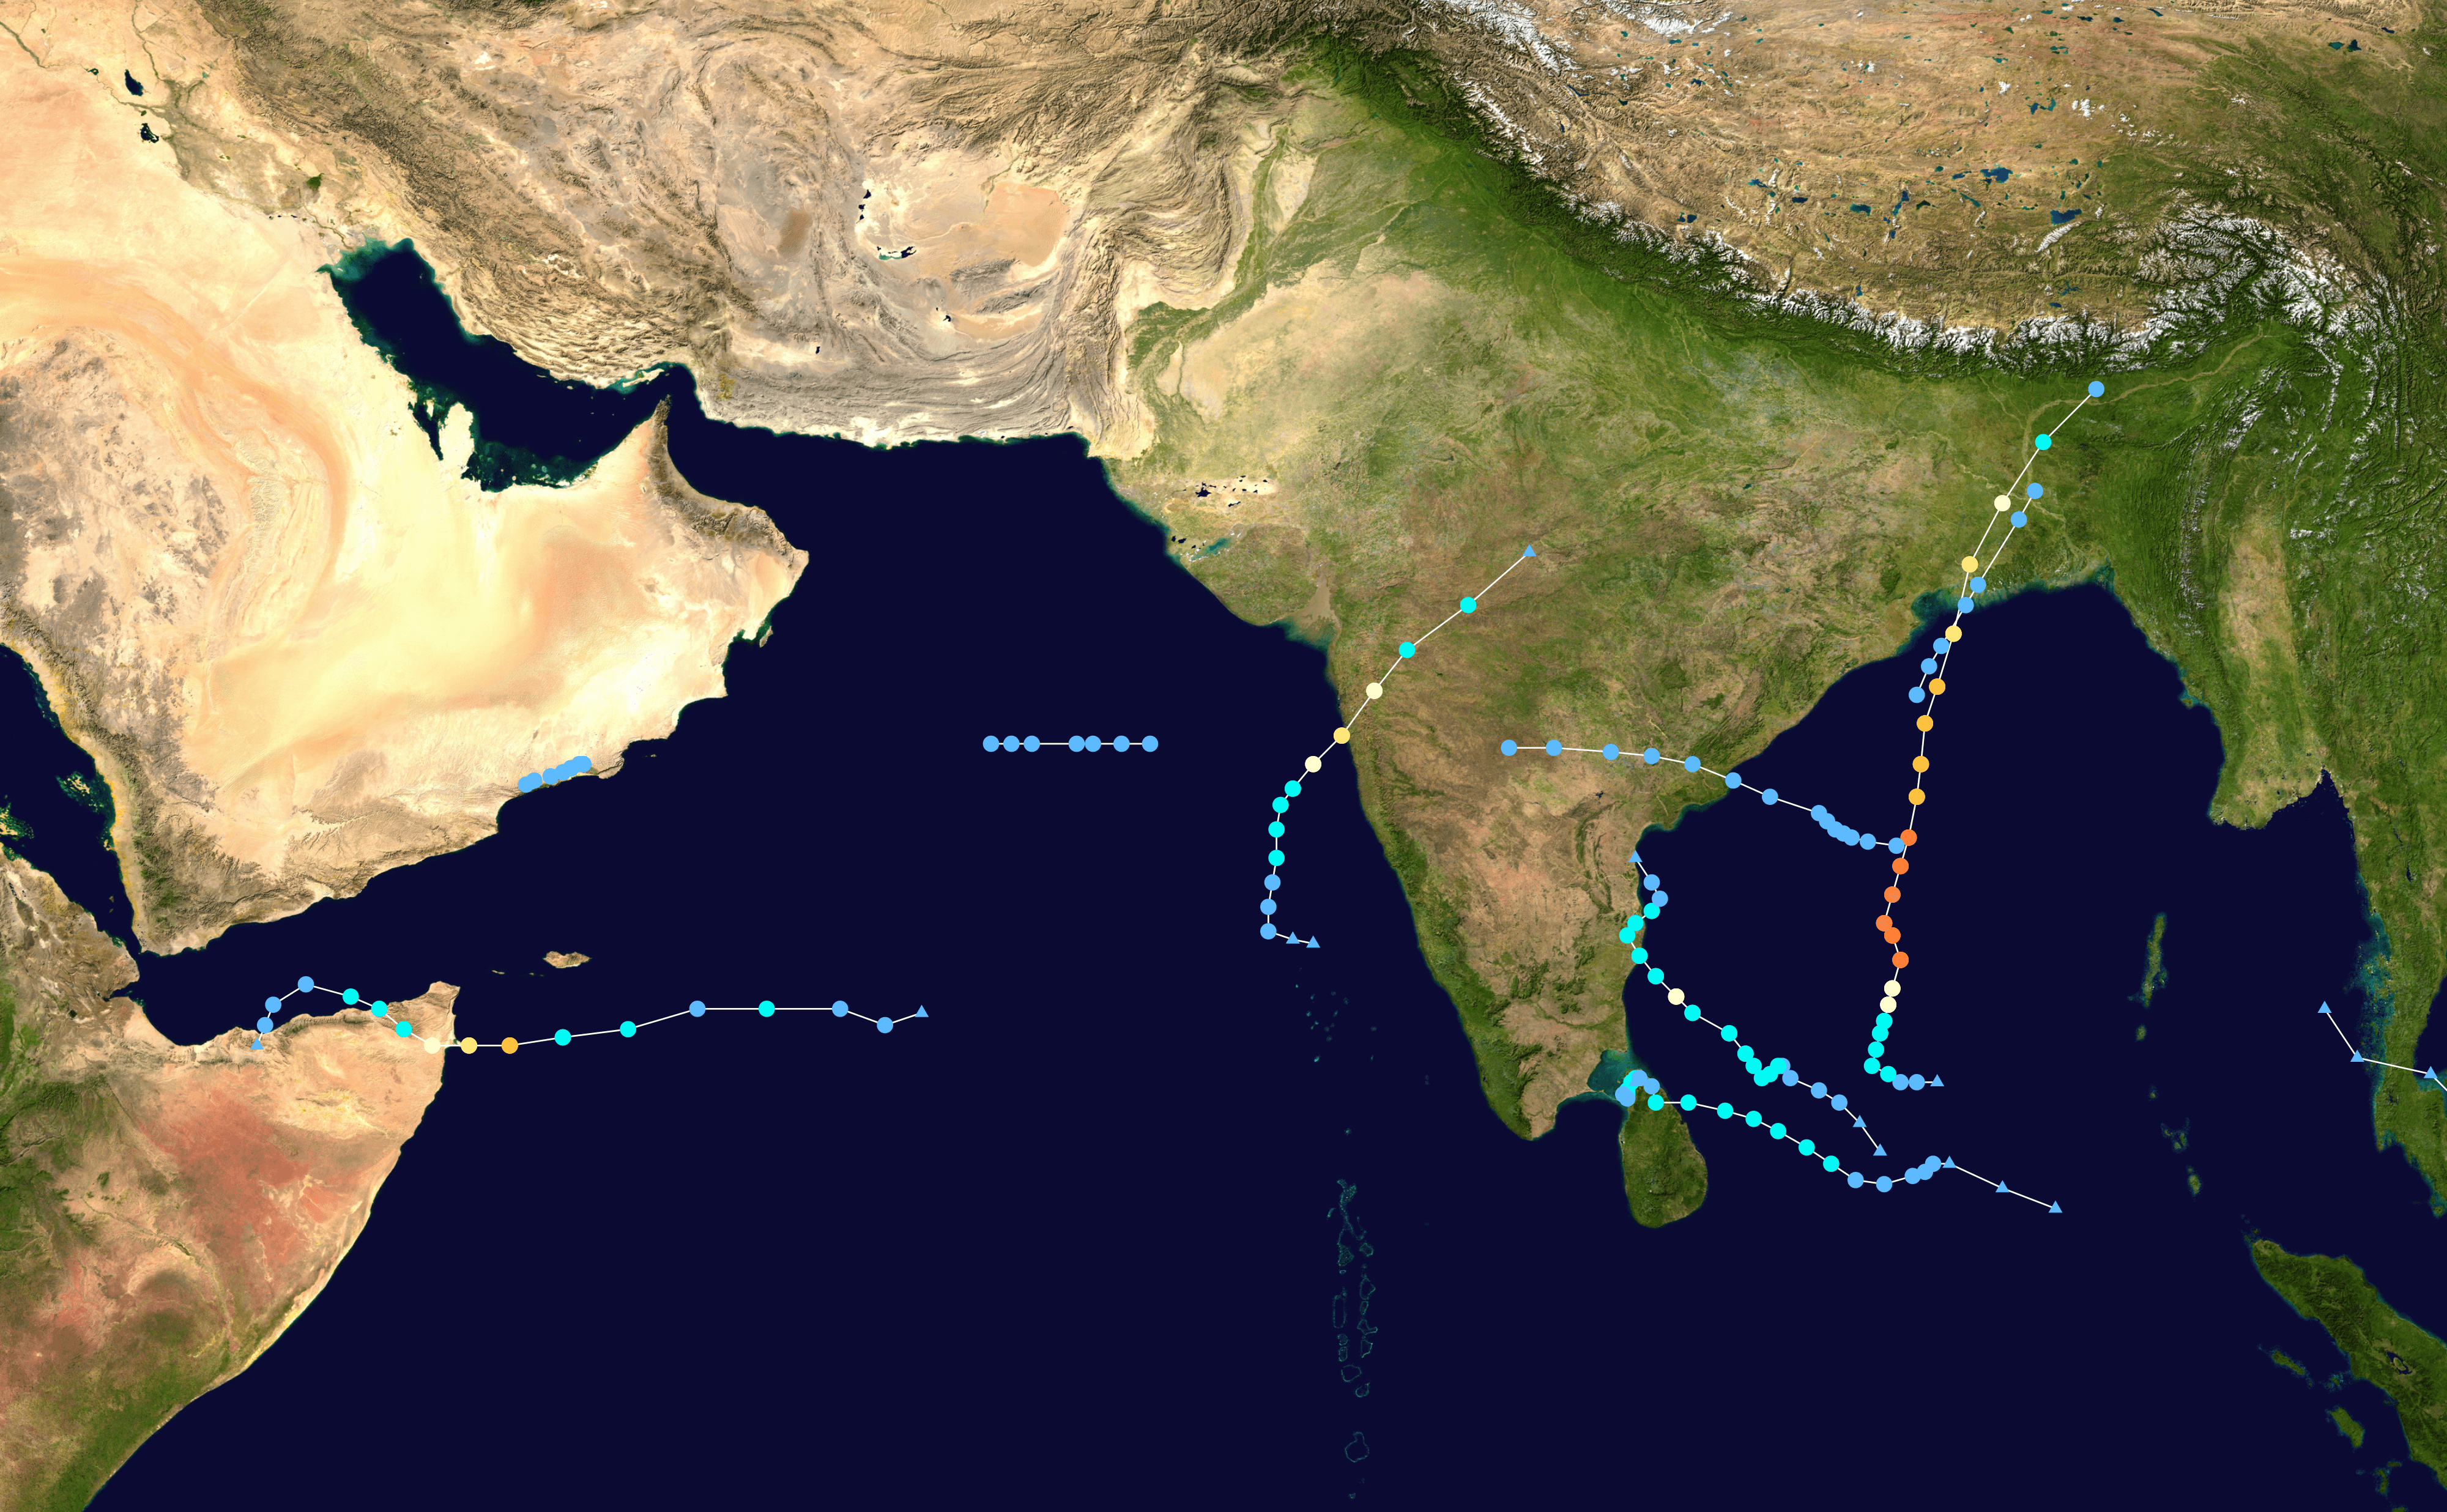
Description: This map shows the tracks of all tropical cyclones in the 2020 North Indian Ocean cyclone season. The points show the location of each storm at 6-hour intervals. The colour represents the storm's maximum sustained wind speeds as classified in the Saffir-Simpson Hurricane Scale (see below), and the shape of the data points represent the type of the storm. Map generation parameters: --res 4000 --extra 1 --dots 0.2 --lines 0.04 --xmin 40 --xmax 100 --ymin 0 --ymax 35
Title: 2020 North Indian Ocean cyclone season summary
Credit: Created using WikiProject Tropical cyclones/Tracks. The background image is from NASA [1]. The tracking data is from the Joint Typhoon Warning Center's best track database
Author: Meow
Usage Terms: Public domain
License: Public domain
Attribution Required?: No
Image usage
The following page links to this image:
