
Image: AYool CCl4 history
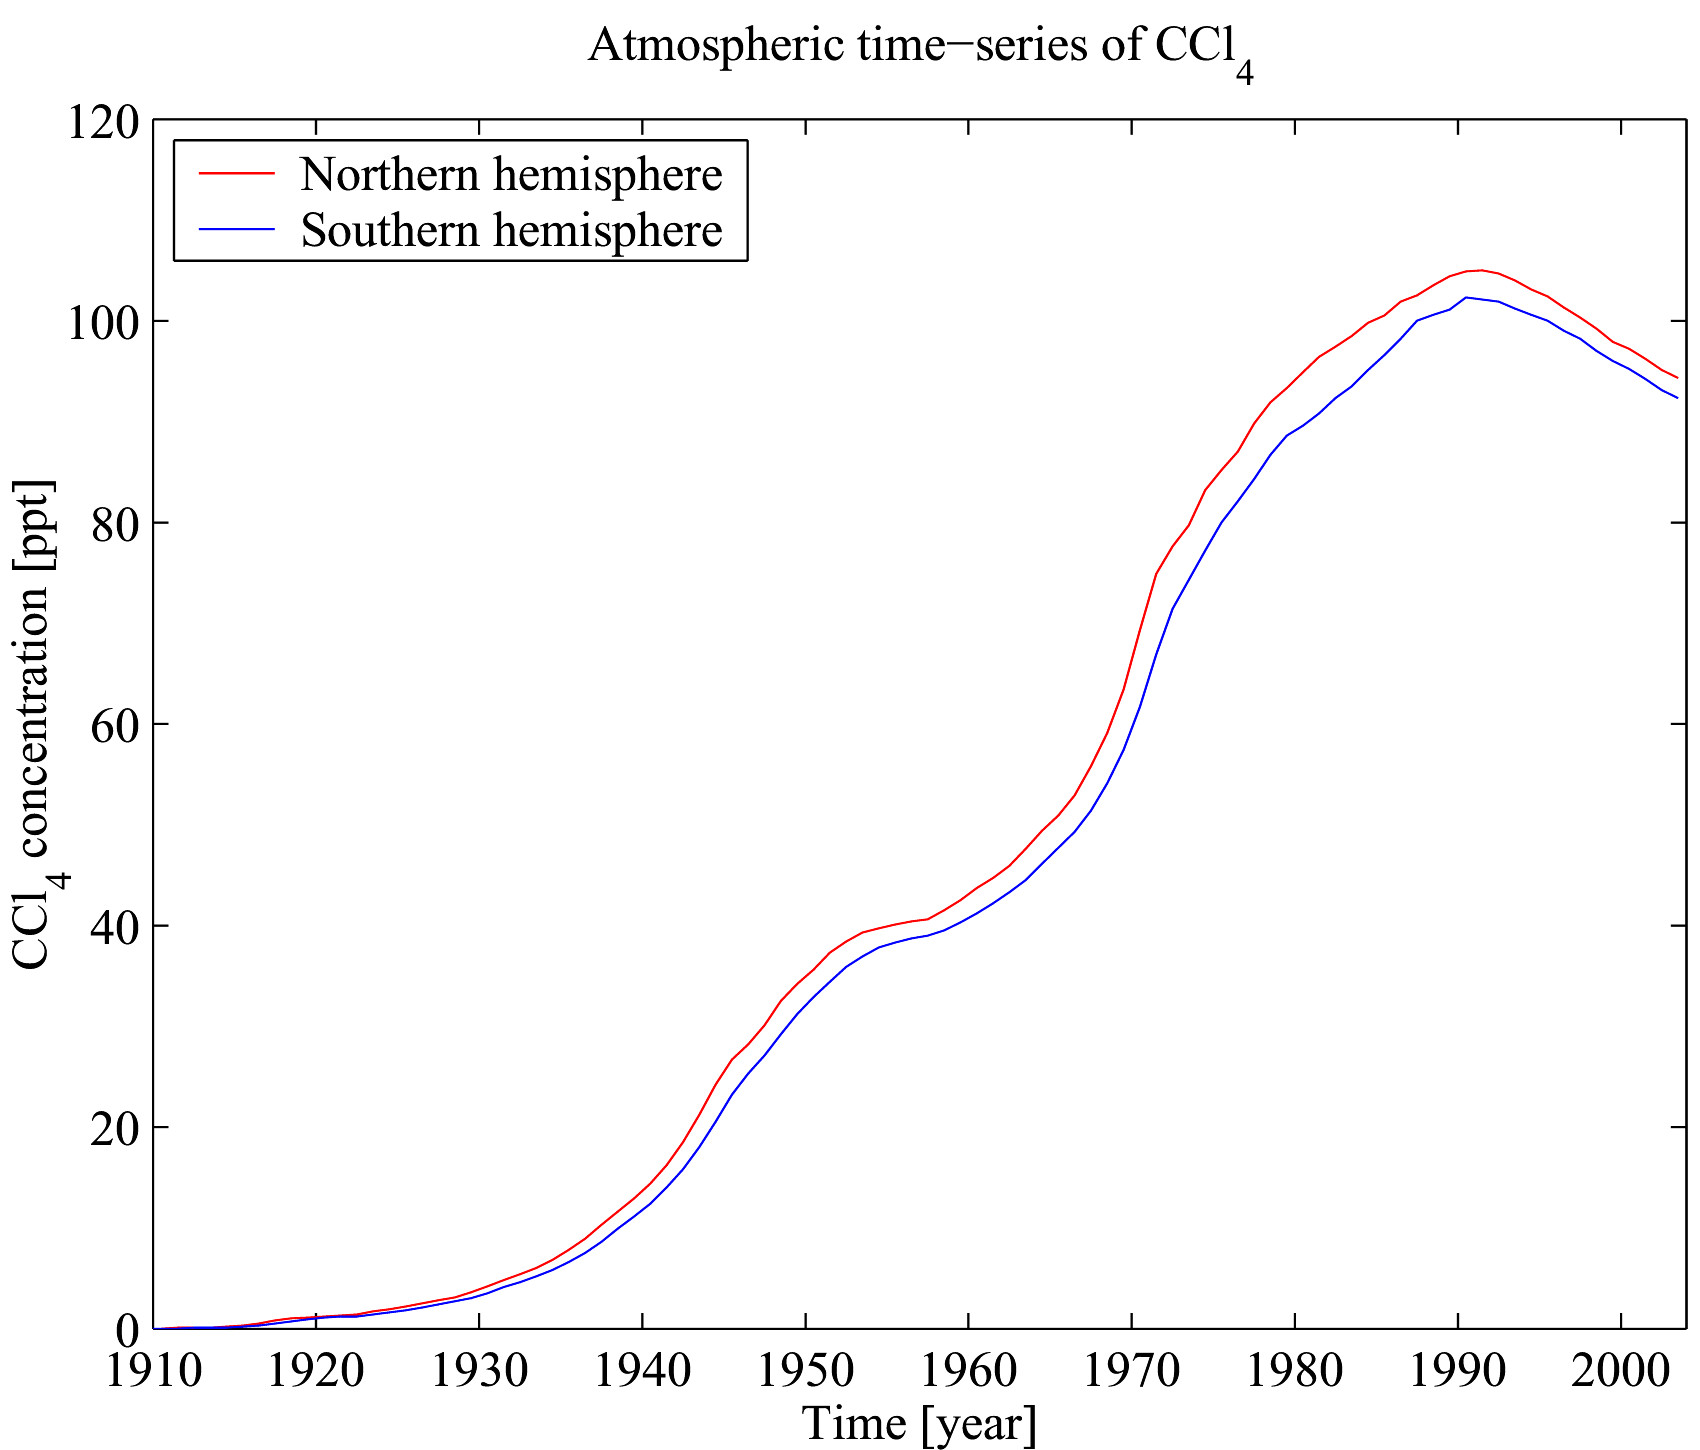
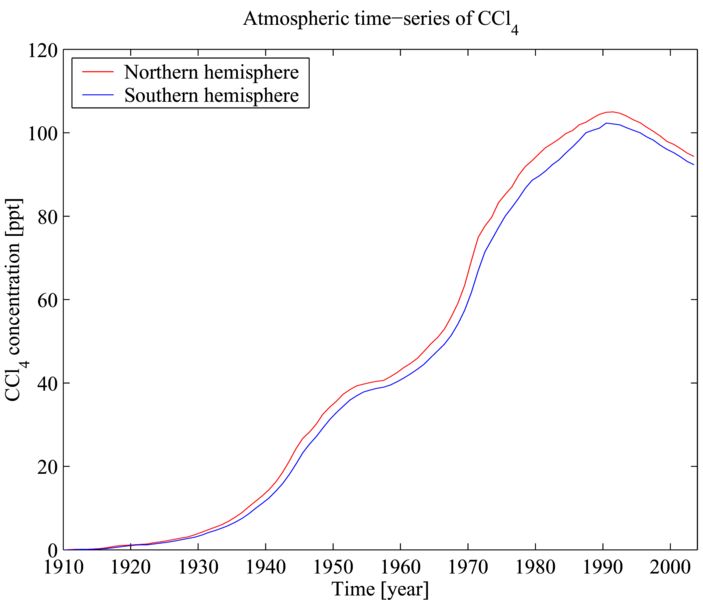
Description: Time series of atmospheric concentrations of carbon tetrachloride from 1908 to 2003. Mixing ratio concentrations are shown for the northern and southern hemispheres, and are expressed as parts per trillion (ppt). The data are plotted here using MATLAB. The published source of data for the figure is Walker, S. J., R. F. Weiss & P. K. Salameh (2000) Reconstructed histories of the annual mean atmospheric mole fractions for the halocarbons CFC-11, CFC-12, CFC-113 and carbon tetrachloride. Journal of Geophysical Research 105, 14285—14296. The data (including error estimates and updates) are available online from the atmospheric halocarbon page at University of California.
Title: AYool CCl4 history
Credit: Transferred from en.wikipedia to Commons by Teratornis using CommonsHelper.
Author: Plumbago at English Wikipedia
Usage Terms: Creative Commons Attribution 2.5
License: CC BY 2.5
License Link: http://creativecommons.org/licenses/by/2.5
Attribution Required?: Yes
Image usage
There are no pages that link to this image.
