
Image: Air traffic optimal climat-cost relation
Size of this preview: 752 × 600 pixels. Other resolutions: 301 × 240 pixels | 1,111 × 886 pixels.
Original image (1,111 × 886 pixels, file size: 197 KB, MIME type: image/jpeg)
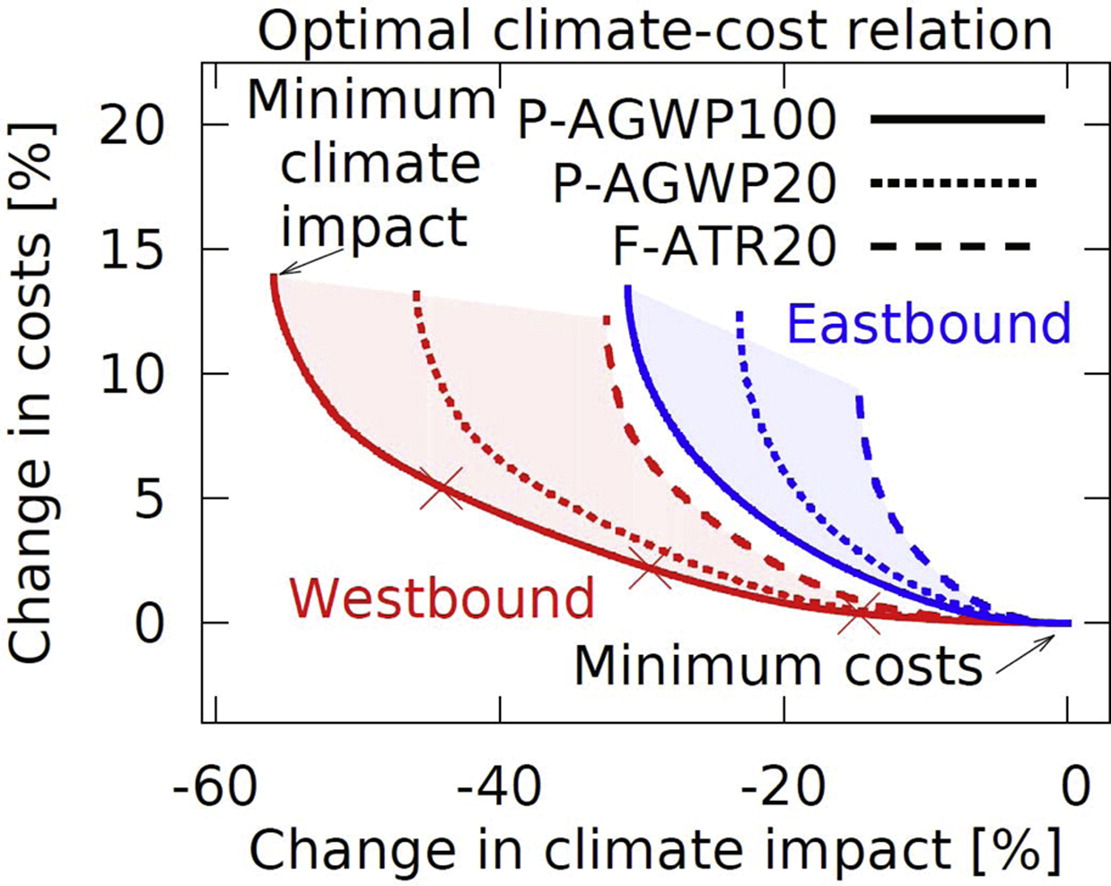
Description: Relation of economic cost changes and climate impact changes for a one-day trans-Atlantic air traffic. Relations for westbound and eastbound flights are in red and blue, respectively. Three different climate metrics are used: P-AGWP100 (solid line), P-AGWP20 (dotted line), and F-ATR20 (dashed line).
Title: Air traffic optimal climat-cost relation
Credit: https://www.sciencedirect.com/science/article/pii/S1352231014004063#undfig1
Author: Volker Grewe; et al.
Permission: published under a Creative Commons license
Usage Terms: Creative Commons Attribution-Share Alike 3.0
License: CC BY-SA 3.0
License Link: https://creativecommons.org/licenses/by-sa/3.0
Attribution Required?: Yes
Image usage
The following 2 pages link to this image:

All content from Kiddle encyclopedia articles (including the article images and facts) can be freely used under Attribution-ShareAlike license, unless stated otherwise.