
Image: Bi phase diagram
Size of this preview: 791 × 600 pixels. Other resolutions: 317 × 240 pixels | 984 × 746 pixels.
Original image (984 × 746 pixels, file size: 244 KB, MIME type: image/png)
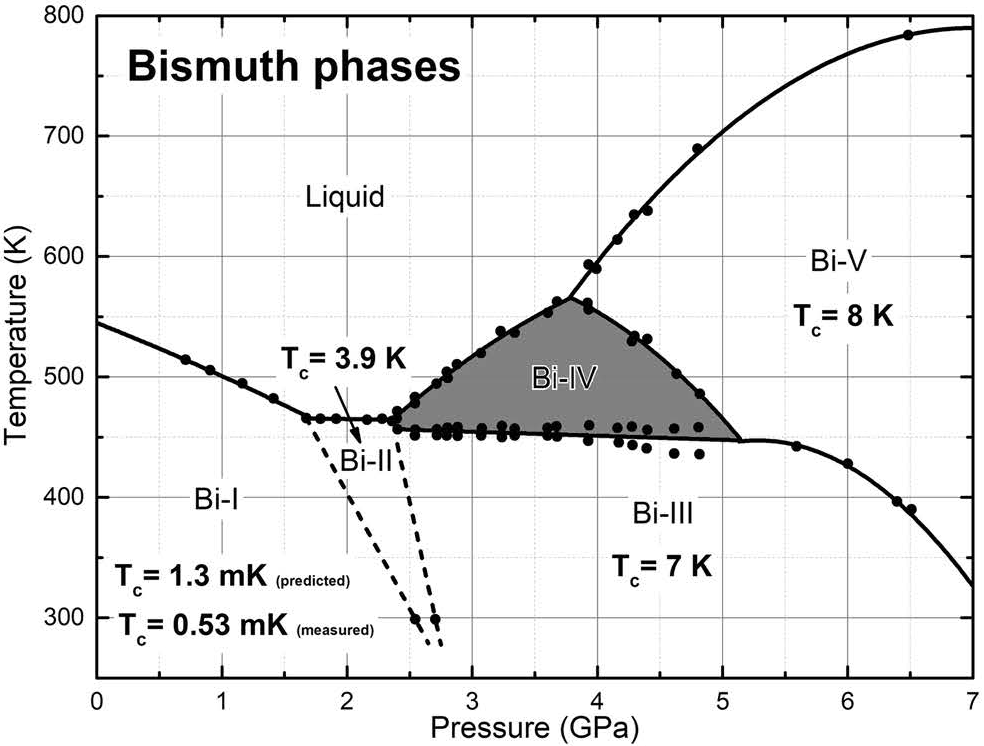
Description: Pressure-temperature phase diagram of bismuth. The lines fit experiment (solid circles) reported in https://journals.aps.org/pr/abstract/10.1103/PhysRev.131.632. Tc refers to superconducting transition temperature
Title: Bi phase diagram
Credit: drawn by Valladares et al. [1] based on data of [2]
Author: Ariel A. Valladares et al.
Usage Terms: Creative Commons Attribution 4.0
License: CC BY 4.0
License Link: https://creativecommons.org/licenses/by/4.0
Attribution Required?: Yes
Image usage
The following page links to this image:

All content from Kiddle encyclopedia articles (including the article images and facts) can be freely used under Attribution-ShareAlike license, unless stated otherwise.