
Image: Canada GHG map 2008-en

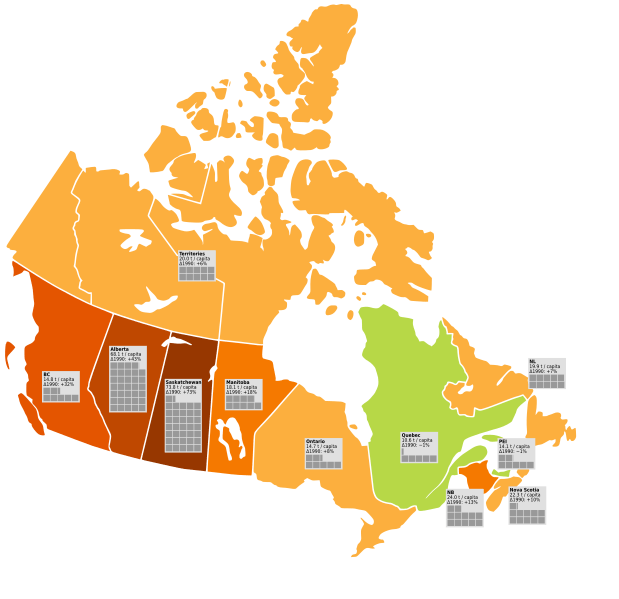
Description: Map of Canada showing the increases in GHG emissions by province/territory in 2008, compared to the 1990 base year. 50%+ increase 30%-50% increase 20%-30% increase 10%-20% increase 0%-10% increase 0%-10% decrease Each square represents 2 tonnes Template:CO2 eq. per capita
Title: Canada GHG map 2008-en
Credit: Canada_GHG_map_2007-en.svg
Author: Canada_GHG_map_2007-en.svg: *Canada_blank_map.svg: Lokal_Profil image cut to remove USA by Paul Robinson derivative work: Bouchecl derivative work: Bouchecl (talk)
Usage Terms: Creative Commons Attribution-Share Alike 3.0
License: CC BY-SA 3.0
License Link: http://creativecommons.org/licenses/by-sa/3.0
Attribution Required?: Yes
Image usage
There are no pages that link to this image.
