
Image: Cie Chart with sRGB gamut by spigget

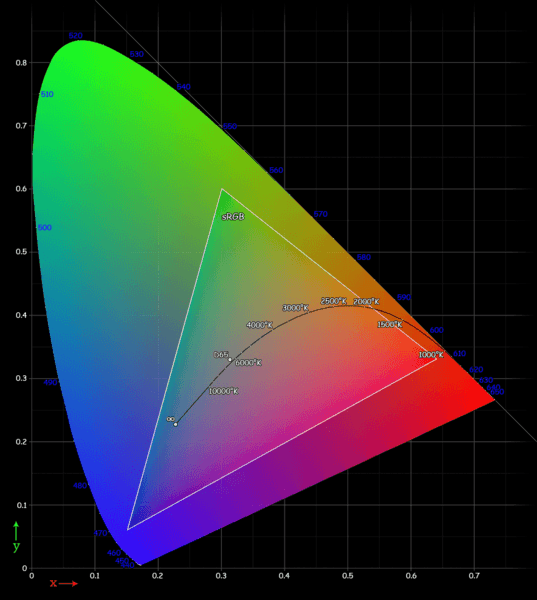
Description: CIE 1931 xy chromaticity diagram showing the gamut of the sRGB color space and location of the primaries. The D65 white point is shown in the center. The Planckian locus is shown with color temperatures labeled in Kelvin. The outer curved boundary is the spectral (or monochromatic) locus, with wavelengths shown in nanometers (blue). Note that the colors in this displayed file are being specified using sRGB. Areas outside the triangle cannot be accurately colored because they are out of the gamut of sRGB, therefore they have been interpolated.
Title: Cie Chart with sRGB gamut by spigget
Credit: Own work
Author: Spigget
Usage Terms: Creative Commons Attribution-Share Alike 3.0
License: CC BY-SA 3.0
License Link: http://creativecommons.org/licenses/by-sa/3.0
Attribution Required?: Yes
Image usage
There are no pages that link to this image.
