
Image: Data visualization process v1

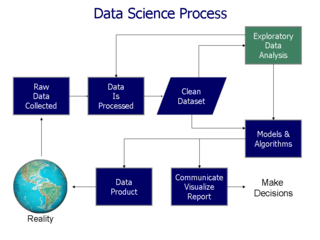
Description: Flowchart showing the data visualization process. Diagram overview This diagram shows the data science process. Data is collected from sensors in the environment, represented by the globe. Data is "cleaned" or otherwise processed to produce a data set (typically a data table) usable for processing. Exploratory data analysis and statistical modeling may then be performed. A "data product" is a program such as retailers use to suggest new purchases based on purchase history. It can also create data and feed it back into the environment. This diagram is based on a similar diagram in "Doing Data Science" by O'Neill and Schutt (2014).[1] Gil Press discussed the history of data science and related terminology in a Forbes article in May 2013.[2] References ↑ O'Neil, Cathy and, Schutt, Rachel (2014) Doing Data Science, O'Reilly ISBN: 978-1-449-35865-5. ↑ Forbes-Gil Press-A Very Short History of Data Science-May 2013
Title: Data visualization process v1
Credit: Transferred from en.wikipedia to Commons.
Author: Farcaster at English Wikipedia
Usage Terms: Creative Commons Attribution-Share Alike 3.0
License: CC BY-SA 3.0
License Link: http://creativecommons.org/licenses/by-sa/3.0
Attribution Required?: Yes
Image usage
There are no pages that link to this image.
