
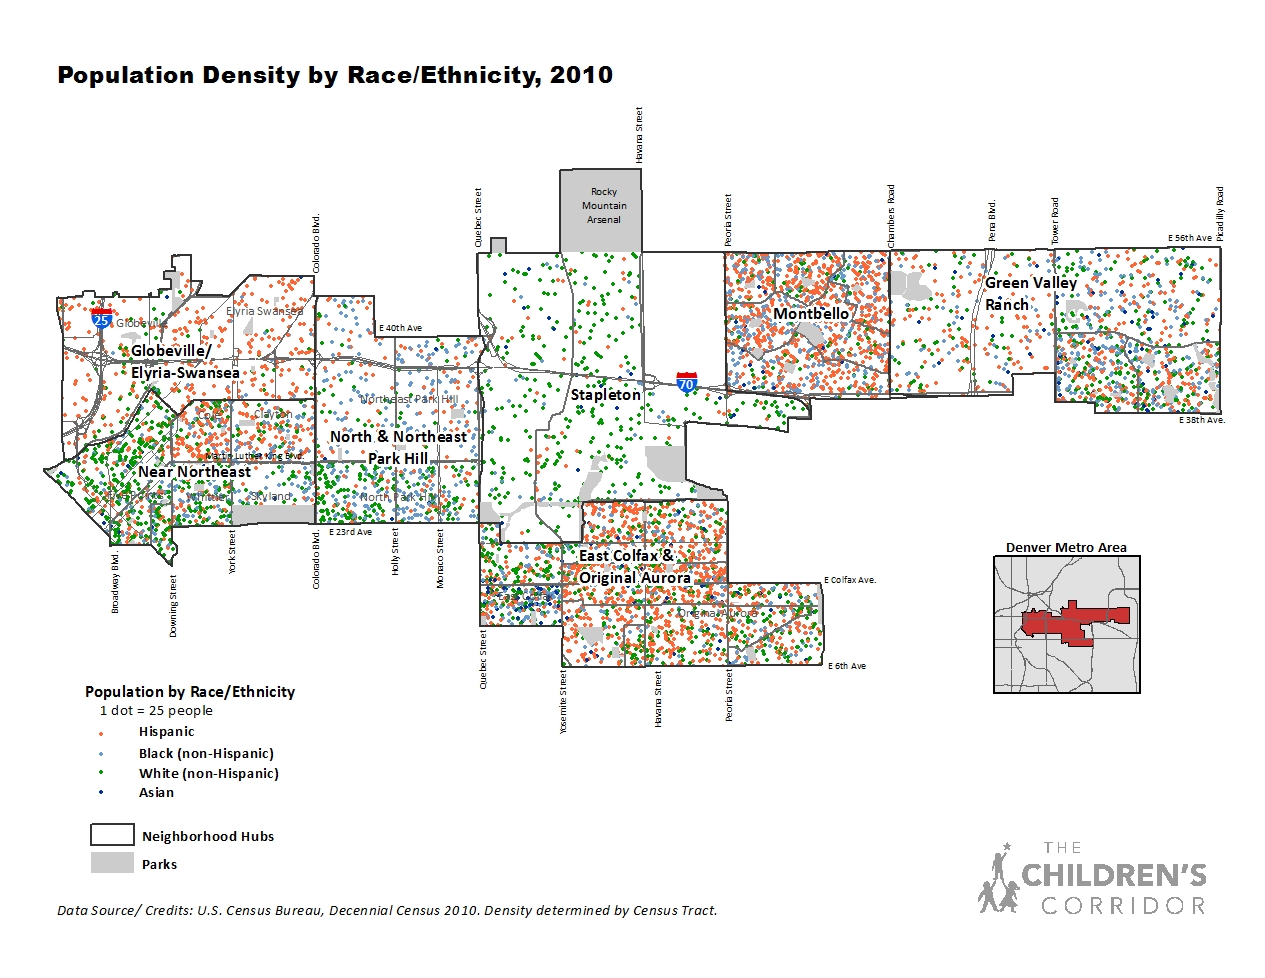
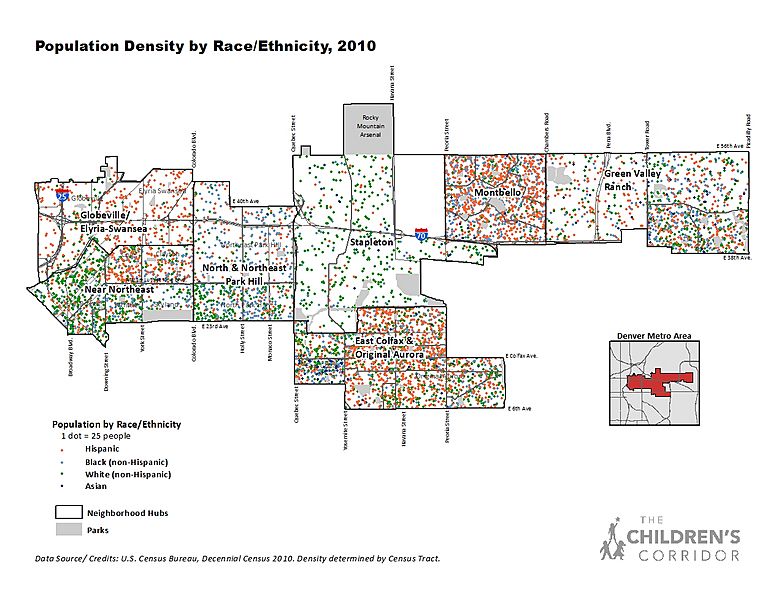
Image: Denver population Density by Race-Ethnicity, 2010
Description: This map allows you to quickly glimpse at an area and see its racial/ethnic makeup and population density. Each dot on this map represents 25 people, and dots are placed randomly within each Census Tract. Dots are color-coded by race/ethnicity. Areas with more dots are more densely populated, and areas with fewer dots are less densely populated. For example, looking the five neighborhoods in Near Northeast, you can see Five Points, Cole and Whittier are more densely populated than Clayton and Skyland. And while Cole has a predominantly Hispanic population, Whittier is more heavily African-American and white. This map was made using 2010 Decennial Census data from the U.S. Census Bureau. For more visualization and analysis of Census data, visit piton.org/census2010. View more maps of the Children’s Corridor
Title: Denver population Density by Race-Ethnicity, 2010
Credit: Population Density by Race/Ethnicity, 2010
Author: Piton Foundation
Usage Terms: Creative Commons Attribution 2.0
License: CC BY 2.0
License Link: http://creativecommons.org/licenses/by/2.0
Attribution Required?: Yes
Image usage
The following page links to this image:
