
Image: Electricity.NZ.TiwaiPoint2000onwards
Size of this preview: 800 × 176 pixels. Other resolutions: 320 × 70 pixels | 1,908 × 419 pixels.
Original image (1,908 × 419 pixels, file size: 25 KB, MIME type: image/png)
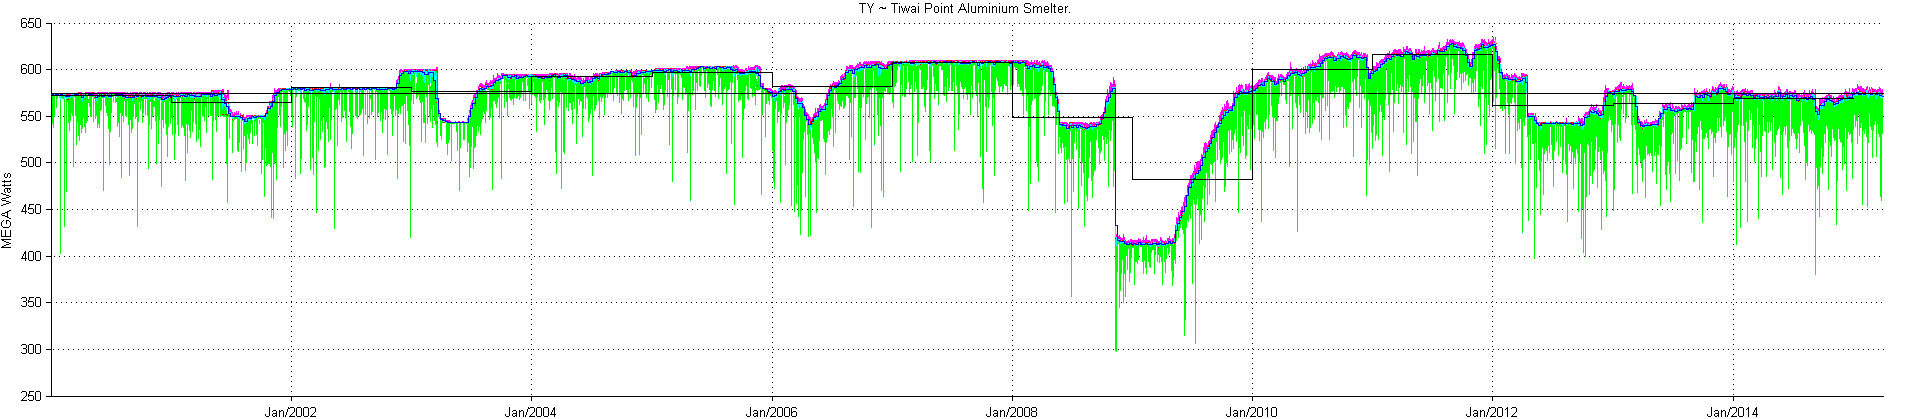
Description: Tiwai Point's electricity usage for 2000 onwards based on half-hourly data supplied to the N.Z. Electricty Commission/authority, stored by Gnash and plotted via MatLab. Daily depictions of max. to upper quartile (magenta), min. - lower quartile (green), daily average (blue), weekly average (dark blue), annual and overall averages in black.
Title: Electricity.NZ.TiwaiPoint2000onwards
Credit: From half-hourly data collected by the NZED et seq, stored by Gnash and plotted by MatLab.
Author: NickyMcLean
Usage Terms: Creative Commons Attribution-Share Alike 3.0
License: CC BY-SA 3.0
License Link: https://creativecommons.org/licenses/by-sa/3.0
Attribution Required?: Yes
Image usage
The following page links to this image:

All content from Kiddle encyclopedia articles (including the article images and facts) can be freely used under Attribution-ShareAlike license, unless stated otherwise.