
Image: Entropyandtemp
Size of this preview: 800 × 529 pixels. Other resolutions: 320 × 212 pixels | 1,770 × 1,170 pixels.
Original image (1,770 × 1,170 pixels, file size: 321 KB, MIME type: image/png)
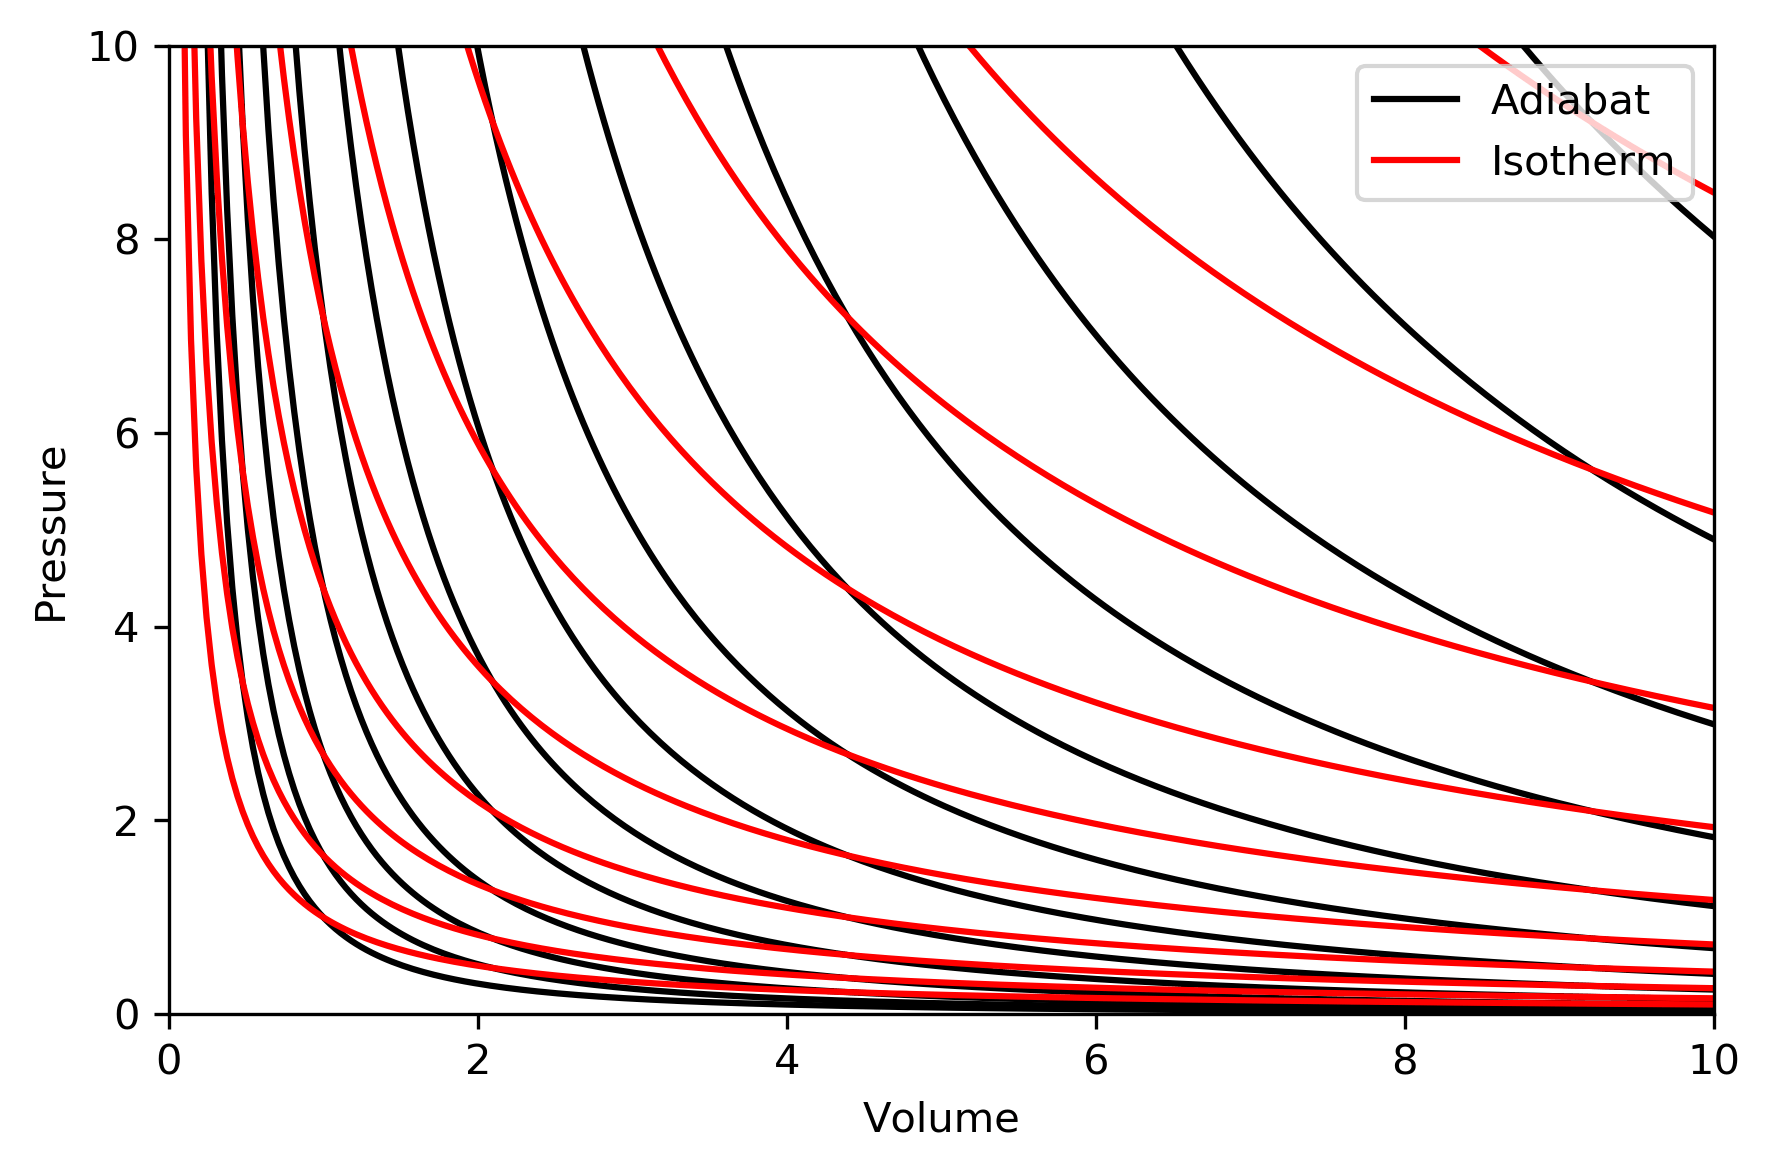
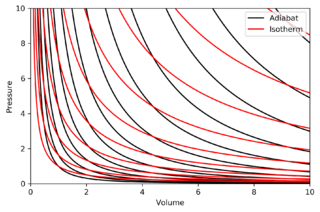
Description: Superposition of Entropy and Temperature Contour Maps (on a P-V diagram). Isotherms are shown as red lines, and adiabats are shown as black lines. This image was made by AugPi. (c) AugPi, 2004. Licensed to Wikimedia.
Title: Entropyandtemp
Credit: Transferred from en.wikipedia to Commons.
Author: AugPi at English Wikipedia
Usage Terms: Creative Commons Attribution-Share Alike 3.0
License: CC-BY-SA-3.0
License Link: http://creativecommons.org/licenses/by-sa/3.0/
Attribution Required?: Yes
Image usage
There are no pages that link to this image.

All content from Kiddle encyclopedia articles (including the article images and facts) can be freely used under Attribution-ShareAlike license, unless stated otherwise.