Image: Function image and preimage 3
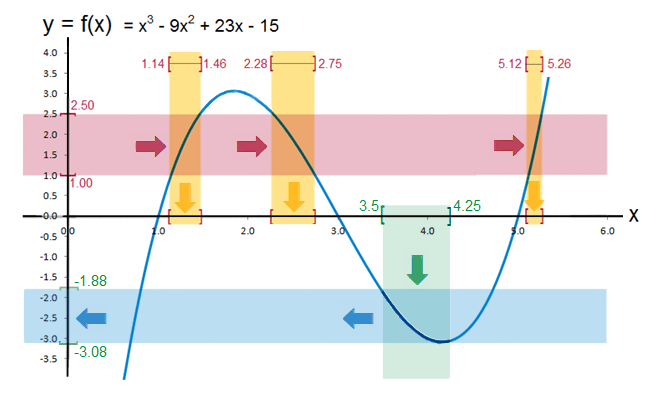
Description: Illustration of y=(x-1)*(x-3)*(x-5) with preimage gotten from y = [1,2.5] and image from x = [3.50, 4.25], with arrows. (This is the graph of the function "f(x) = x3 − 9x2 + 23x − 15", when written in unfactored form.) The interval A = [3.5, 4.25] is a subset of the domain, thus it is shown as part of the x-axis (green). The image of A is (approximately) the interval [−3.08, −1.88]. It is obtained by projecting to the y-axis (along the blue arrows) the intersection of the graph with the light green area consisting of all points whose x-coordinate is between 3.5 and 4.25, the part of the (vertical) y-axis shown in blue. The preimage of B = [1, 2.5] consists of three intervals. They are obtained by projecting the intersection of the light red area with the graph to the x-axis.
Title: Function image and preimage 3
Credit: Graph derived from Excel and artwork added via Autodesk Sketchbook Pro
Author: Wvbailey
Usage Terms: Creative Commons Attribution-ShareAlike 3.0
License: CC-BY-SA-3.0
License Link: https://creativecommons.org/licenses/by-sa/3.0/
Attribution Required?: Yes
Image usage
There are no pages that link to this image.


