
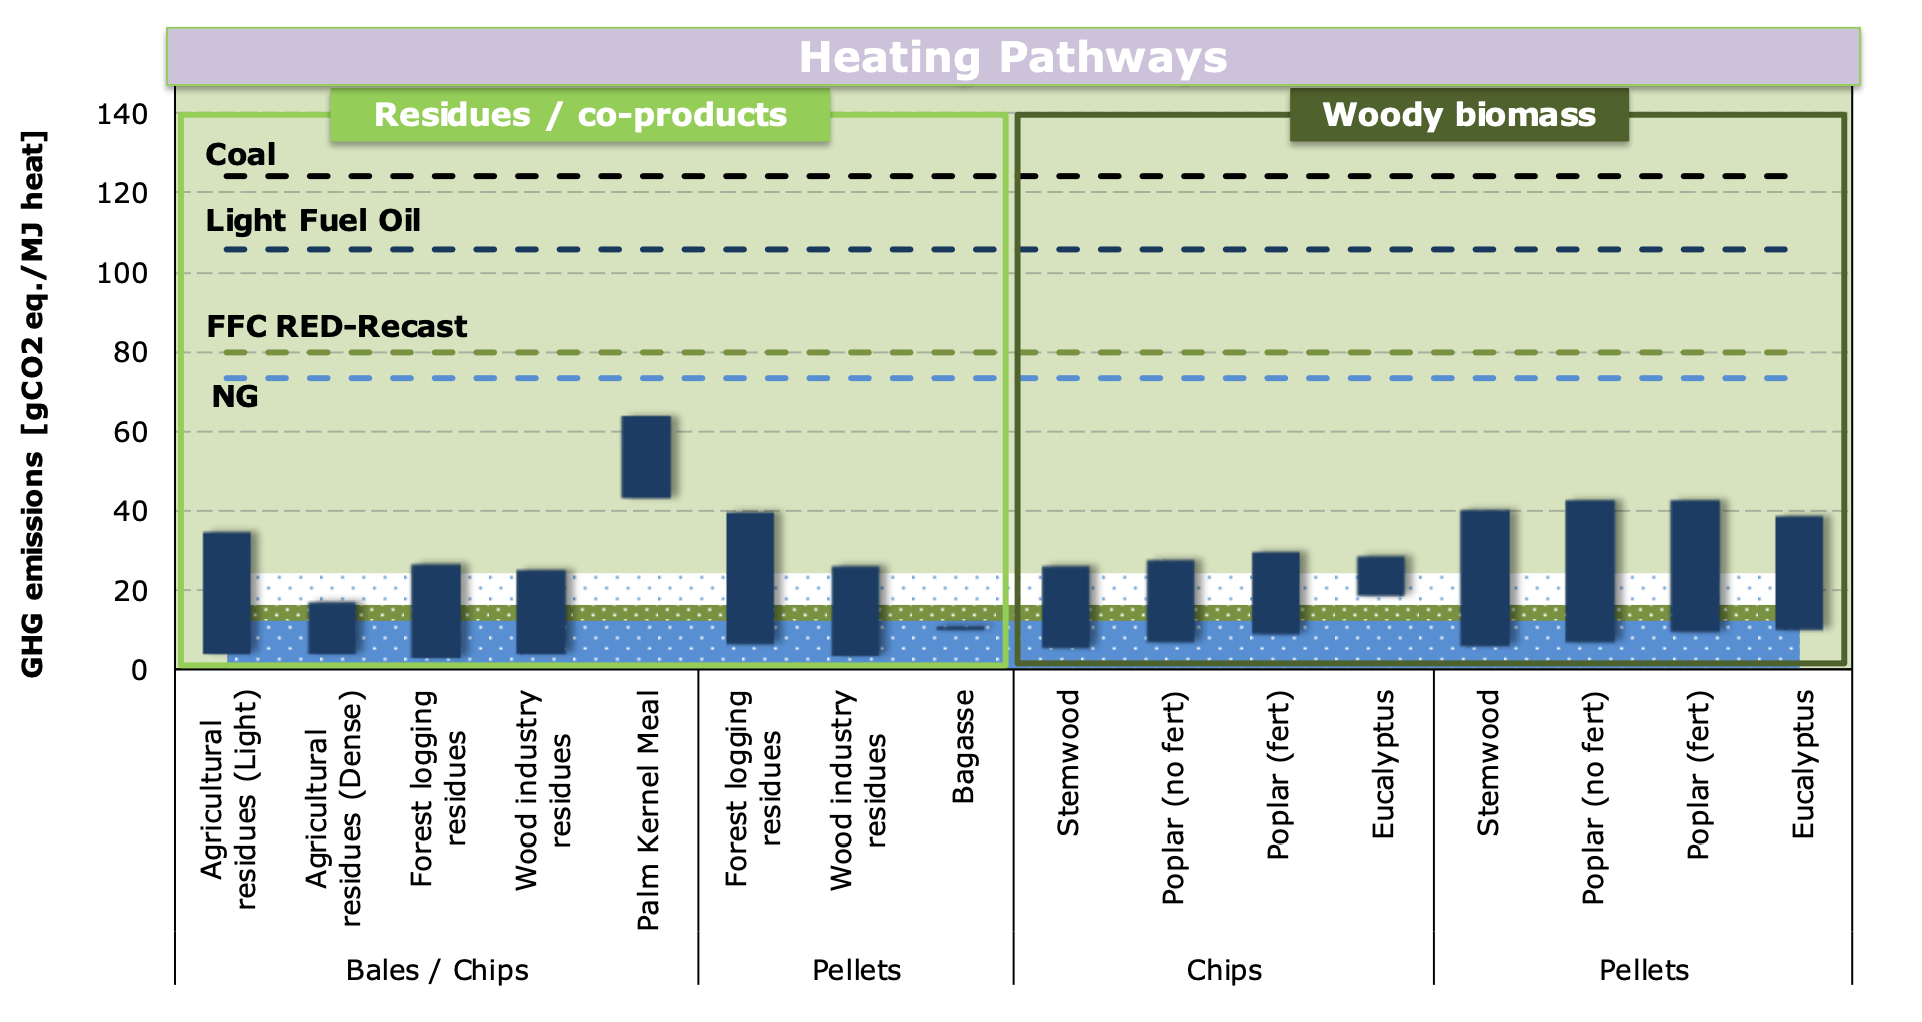
Image: GHG emissions from pathways for the production of heating from various biomass feedstocks
Description: "The floating bars represent the range of variability results found in multiple studies and/or obtained for multiple supply chains definitions: the lowest bound represents the minimum value found, the highest the maximum. Supply chains for which only one value was available are represented as a single line. Dashed lines report, for illustrative purposes, the GHG emissions associated to multiple alternative energy systems available in the EU: Black line = EU-coal heat plant (Source: Edwards et al. 2014); Dark blue line: EU-Light fuel oil heat plant (Source: Edwards et al. 2014 ); Blue line = EU-natural gas heat plant (Source: Edwards et al. 2014); Green line: Fossil Fuel Comparator as defined in EC (2016). The coloured areas represent levels of GHG emissions savings of the bioenergy commodity compared to the legally defined fossil fuel comparator (Giuntoli et al. 2017): the white area indicates GHG savings above 70%, the green area, above 80% and the blue area, above 85%." (p. 97)
Title: GHG emissions from pathways for the production of heating from various biomass feedstocks
Credit: https://op.europa.eu/en/publication-detail/-/publication/358c6d4b-1783-11e8-9253-01aa75ed71a1
Author: Camia A., Robert N., Jonsson R., Pilli R., García-Condado S., López-Lozano R., van der Velde M., Ronzon T., Gurría P., M’Barek R., Tamosiunas S., Fiore G., Araujo R., Hoepffner N., Marelli L., Giuntoli J.
Usage Terms: Creative Commons Attribution 4.0
License: CC BY 4.0
License Link: https://creativecommons.org/licenses/by/4.0
Attribution Required?: Yes
Image usage
