
Image: High plains fresh groundwater usage 2000

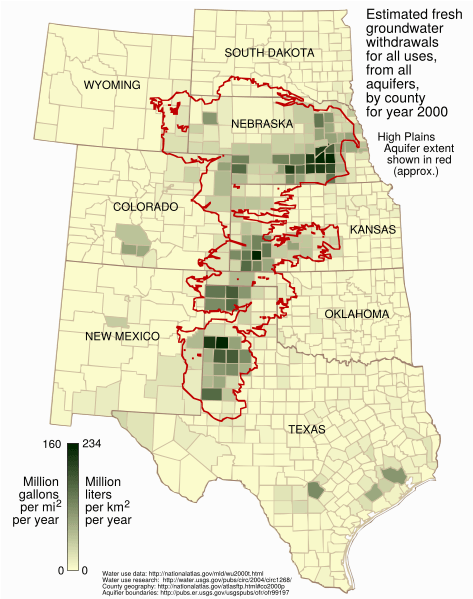
Description: This map shows the estimated fresh water usage per square mile in the year 2000 for counties in the eight states underlain in part by the High Plains (Ogallala) Aquifer, presented as million gallons per square mile and million liters per square kilometer. Usage is for all purposes -- public supply, industrial, irrigation, mining, livestock, and thermoelectric power -- from all underground sources, not just from the Ogallala Aquifer.
Water usage data for the year 2000 was taken from the datafile wu2000t.dbf[1] from the US National Atlas[2]. Citation information from the metadata for that file:
Originator U.S. Geological Survey, Water Resources of the United States Publication_Date 200509 Title Estimated Use of Water in the United States, 2000 Geospatial_Data_Presentation_Form Database Publication_Information
Publication_Place Reston, VA Publisher National Atlas of the United States
Online_Linkage <http://nationalatlas.gov/atlasftp.html?openChapters=chpwater#chpwater>
Additionally:
Supplemental_Information Data were drawn from Circular 1268 which serves as one of the few sources of information about regional or national trends in water withdrawals. Circular 1268 provides information on eight categories of water use: public supply, domestic, irrigation, livestock, aquaculture, industrial, mining, and thermoelectric power. The complete report can be found at http://water.usgs.gov/pubs/circ/2004/circ1268/
The attribute used in this map is described:
Attribute_Label To-wgwfr Attribute_Definition The estimated total ground water withdrawals of fresh water for all categories, in millions of gallons per day. Totals may include null values (unknowns) for domestic, livestock, or mining use. These categories generally represent negligible amounts of water use for a county. Attribute_Definition_Source National Atlas of the United States
The data is supplied as million gallons per day, by county. To arrive at an annual amount per square mile per year, the usage value from wu2000t.dbf was multiplied by 365 and divided by the number of square miles in the county as given in the 2000 county shapefile co2000p020 from the National Atlas:
Citation_Information
Originator National Atlas of the United States Publication_Date 200506 Title 2000 County Boundaries of the United States Publication_Information
Publication_Place Reston, VA Publisher National Atlas of the United States
Online_Linkage <http://nationalatlas.gov/atlasftp.html>
Aquifer boundaries taken from Fischer and McGuire[3].
The map is presented in a Lambert azimuthal equal-area projection as used in the National Atlas (EPSG:2163[4]), the central meridian and latitude of which align nicely with the aquifer.
Author: Kbh3rd
Usage Terms: Creative Commons Attribution-Share Alike 3.0
License: CC-BY-SA-3.0
License Link: http://creativecommons.org/licenses/by-sa/3.0/
Attribution Required?: Yes
Image usage
The following 3 pages link to this image:
