
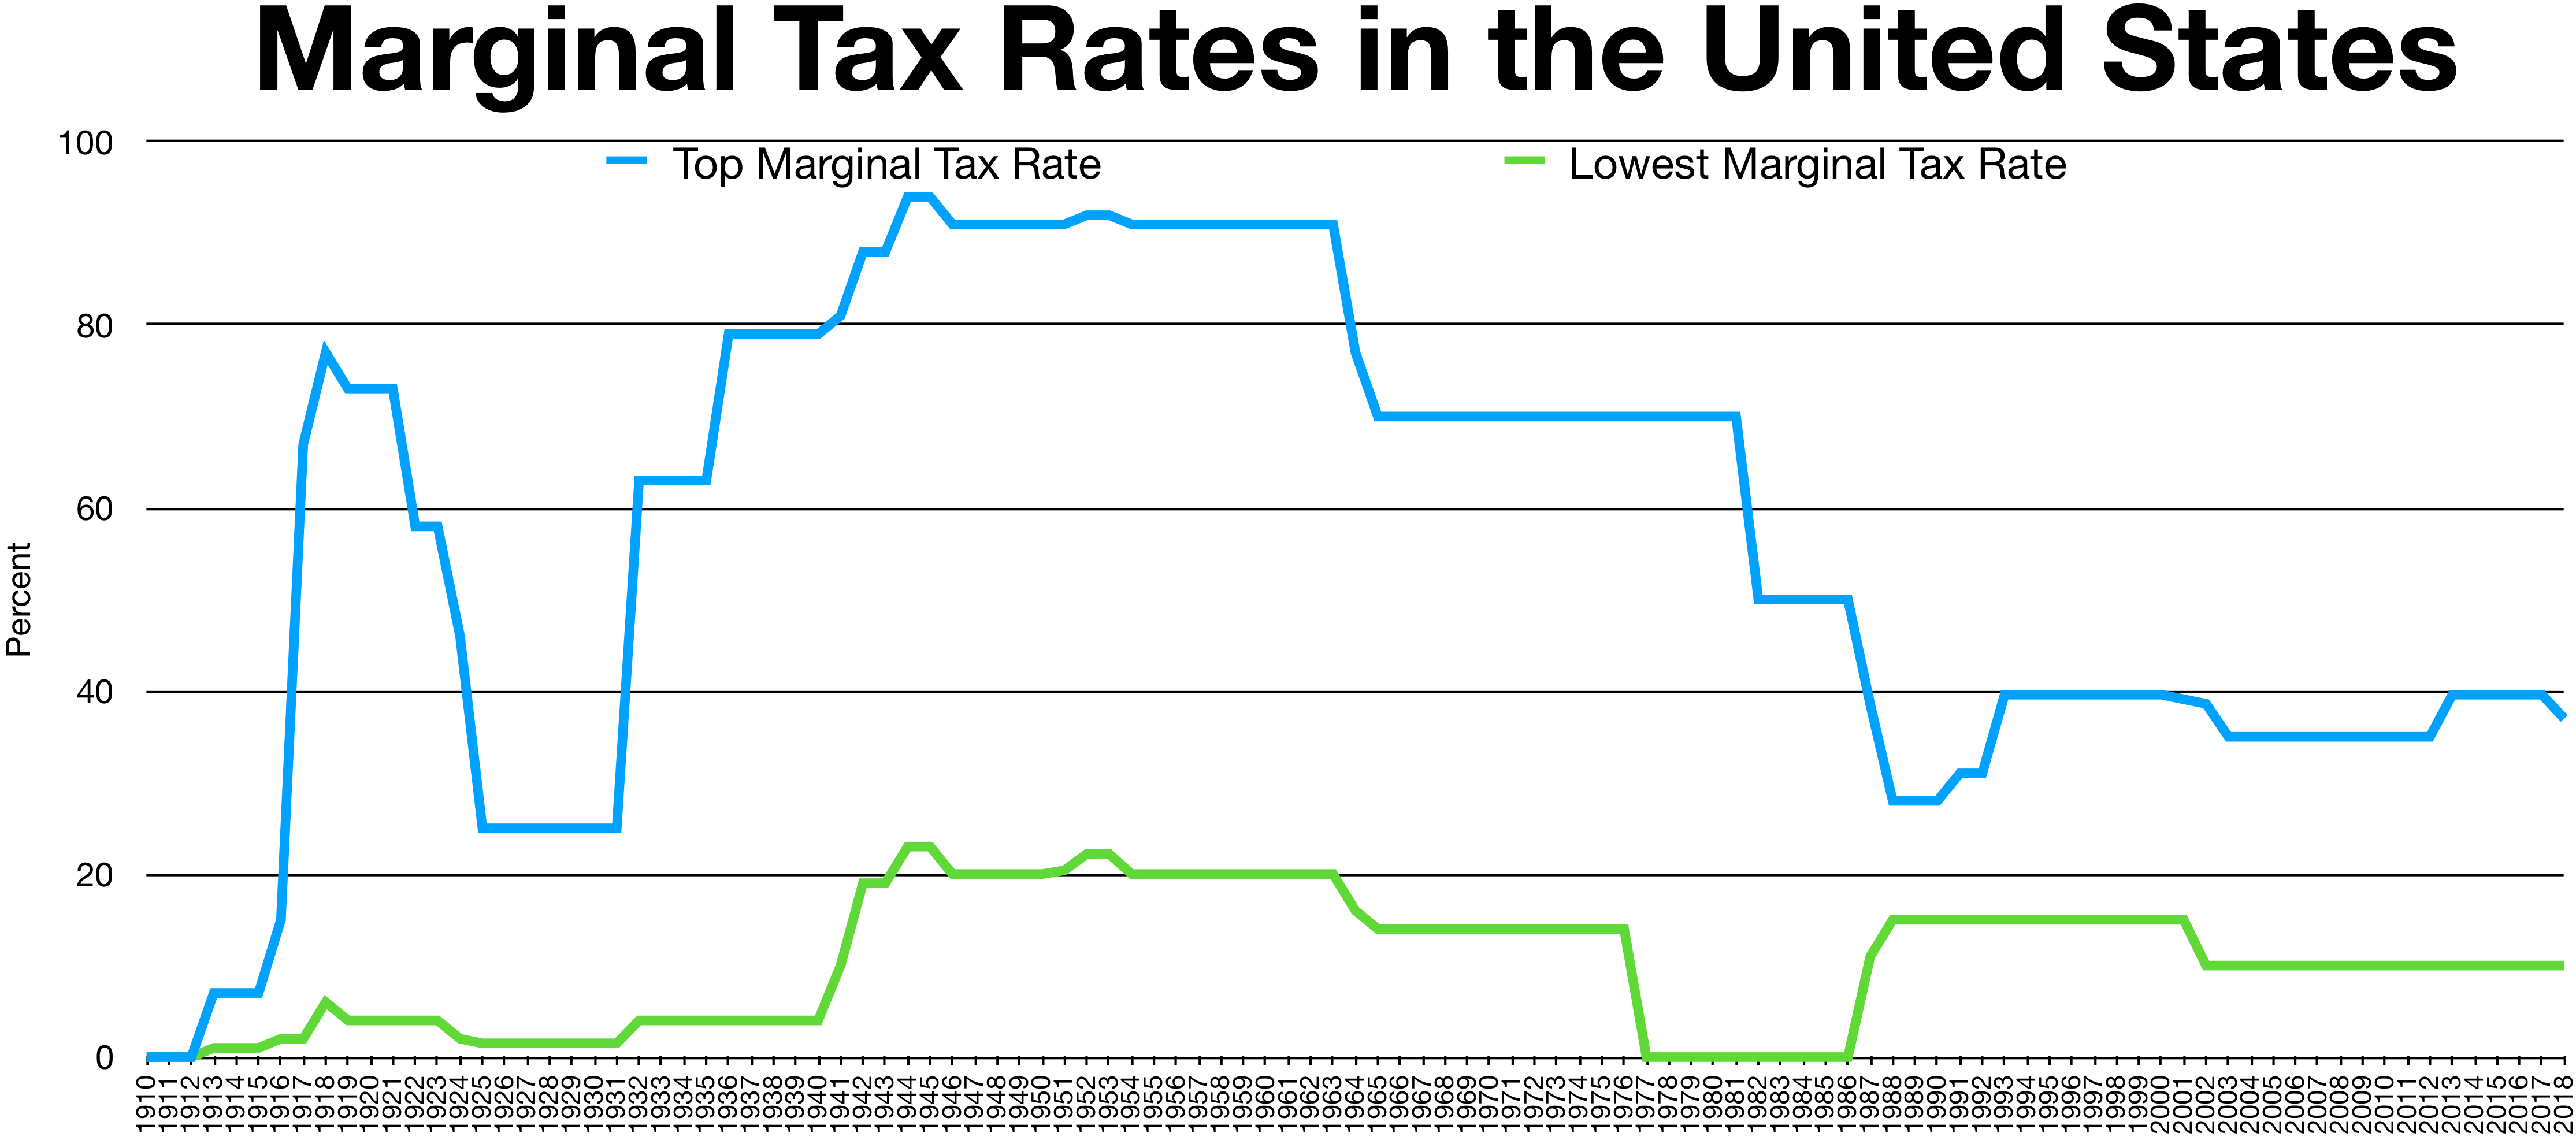
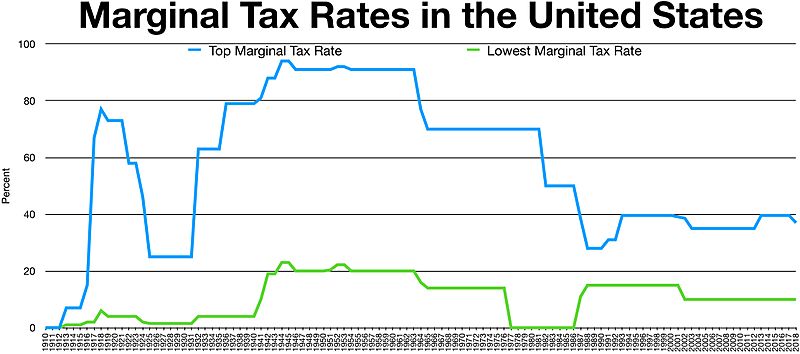
Image: Historical Marginal Tax Rate for Highest and Lowest Income Earners
Size of this preview: 800 × 354 pixels. Other resolutions: 320 × 142 pixels | 4,458 × 1,973 pixels.
Original image (4,458 × 1,973 pixels, file size: 1.3 MB, MIME type: image/jpeg)
Description: Historical graph of the marginal tax rates for the highest and lowest income earners, 1913-2015.
Title: Historical Marginal Tax Rate for Highest and Lowest Income Earners
Credit: Own work Source:Tax Foundation, "U.S. Federal Individual Income Tax Rates History, 1862-2013", 17 October 2013. Weblink: http://taxfoundation.org/article/us-federal-individual-income-tax-rates-history-1913-2013-nominal-and-inflation-adjusted-brackets
Author: Guest2625
Usage Terms: Creative Commons Attribution-Share Alike 3.0
License: CC BY-SA 3.0
License Link: http://creativecommons.org/licenses/by-sa/3.0
Attribution Required?: Yes
Image usage
There are no pages that link to this image.

All content from Kiddle encyclopedia articles (including the article images and facts) can be freely used under Attribution-ShareAlike license, unless stated otherwise.