
Image: Houtman Abrolhos sea temperature and salinity
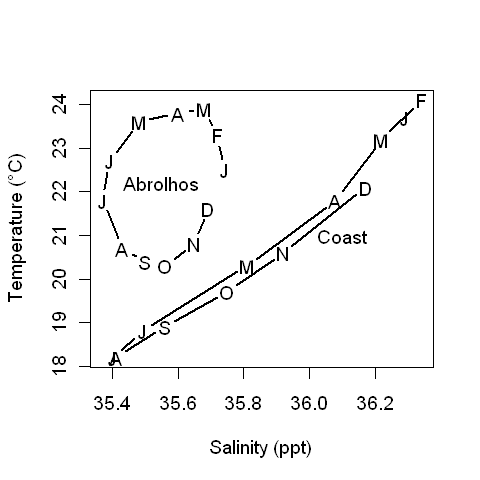
Description: This is a plot showing the annual variability of ocean temperature and salinity in the Houtman Abrolhos and the adjacent coast. The actual data is monthly means from five metre deep sensors at Rat Island in the Houtman Abrolhos, and Dongara on the coast. The data was taken from Table 2 of Pearce, Alan (1997) "The Leeuwin Current and the Houtman Abrolhos" in Wells, F. E. (ed) The Marine Flora and Fauna of the Houtman Abrolhos Islands, Western Australia, Volume 1, pp 11–46. This plot effectively reproduces Figure 9 of that paper. The plot was created in R. The source code for reproducing it is as follows: plot(co_sal, co_temp, type="b", pch="", xlab="Salinity (ppt)", ylab="Temperature (°C)", xlim=range(c(ha_sal, co_sal))) text(co_sal, co_temp, lab=c("J", "F", "M", "A", "M", "J", "J", "A", "S", "O", "N", "D")) lines(ha_sal, ha_temp, type="b", pch="") text(ha_sal, ha_temp, lab=c("J", "F", "M", "A", "M", "J", "J", "A", "S", "O", "N", "D")) text(35.55,22.2,"Abrolhos") text(36.1,21,"Coast")
Title: Houtman Abrolhos sea temperature and salinity
Credit: Original work
Author: Hesperian
Permission: You may select the license of your choice.
Usage Terms: Creative Commons Attribution-Share Alike 4.0
License: CC BY-SA 4.0
License Link: https://creativecommons.org/licenses/by-sa/4.0
Attribution Required?: Yes
Image usage
The following page links to this image:
