
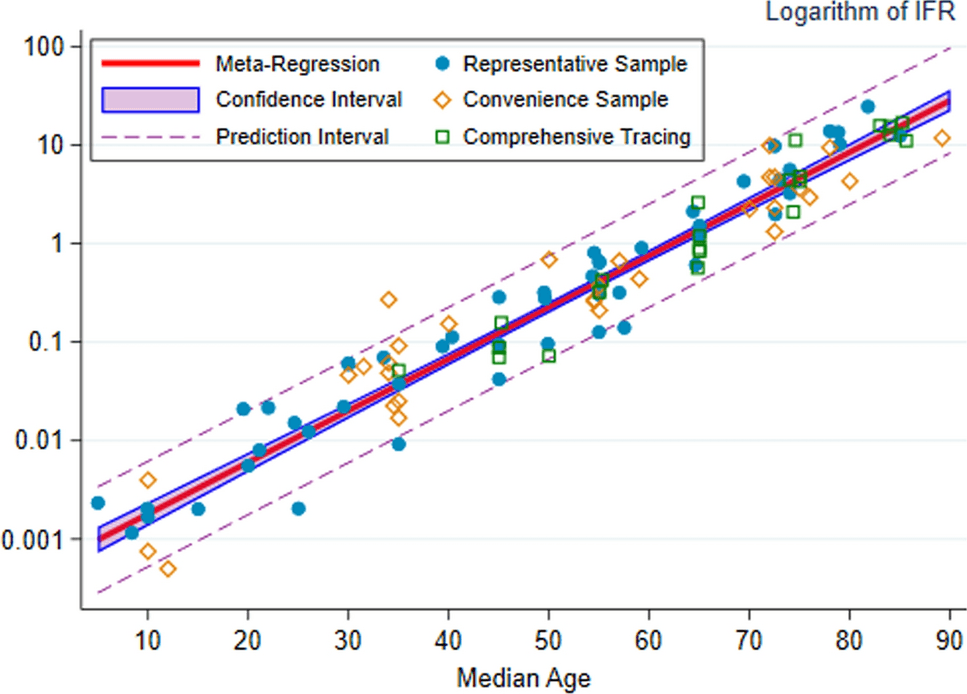
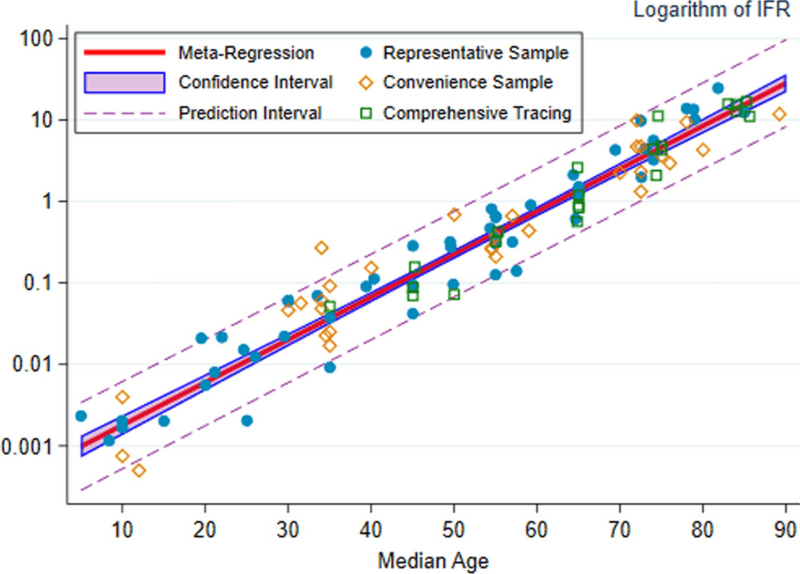
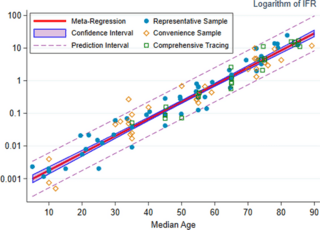
Image: Log Graph of Covid-19 Infection Fatality Ratio by age
Description: The log-linear relationship between IFR and age. Note: Our metaregression indicates that the infection fatality rate (IFR) increases exponentially with age, and hence this figure uses a base-10 logarithmic scale so that the relationship is evident across all ages from 5 to 95 years. Each marker denotes a specific metaregression observation, that is, the IFR for a particular age group in a particular location. The marker style reflects the type of observation: circles for observations from seroprevalence studies of representative samples, diamonds for seroprevalence studies of convenience samples, and squares for countries with comprehensive tracing programs. The red line denotes the metaregression estimate of IFR as a function of age, the shaded region depicts the 95% confidence interval for that estimate. The dashed lines denote the prediction interval (which includes random variations across studies and age groups), and almost all of the 108 metaregression observations lie within that interval. (Text copied from the same source, which is available under a Creative Commons Attribution 4.0 International License)
Title: Log Graph of Covid-19 Infection Fatality Ratio by age
Credit: https://link.springer.com/article/10.1007/s10654-020-00698-1 Assessing the age specificity of infection fatality rates for COVID-19: systematic review, meta-analysis, and public policy implications.
Author: Andrew T. Levin, William P. Hanage, Nana Owusu-Boaitey, Kensington B. Cochran, Seamus P. Walsh & Gideon Meyerowitz-Katz
Usage Terms: Creative Commons Attribution 4.0
License: CC BY 4.0
License Link: https://creativecommons.org/licenses/by/4.0
Attribution Required?: Yes
Image usage
There are no pages that link to this image.
