
Image: LogisticMap BifurcationDiagram
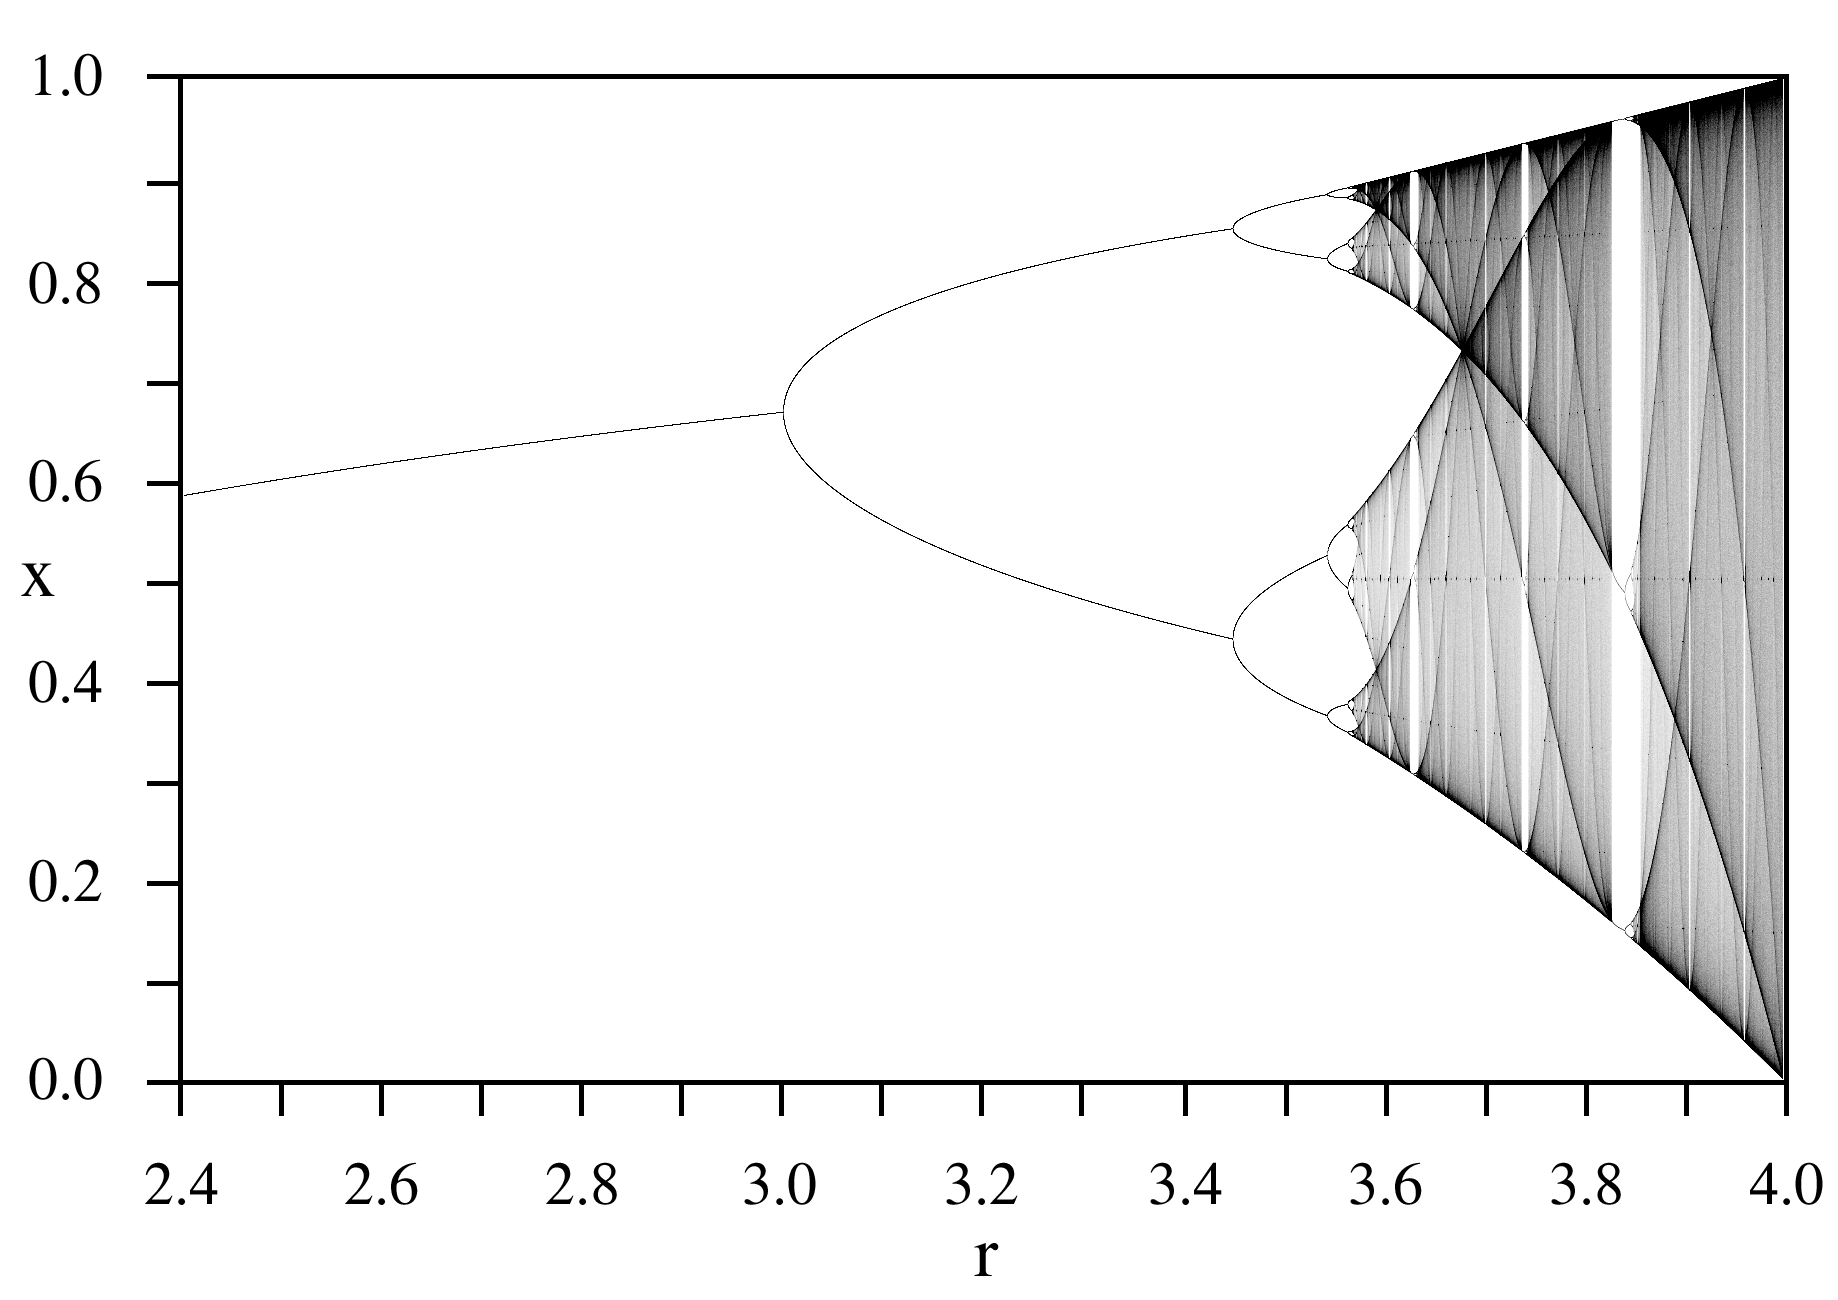
Description: A bifurcation diagram for the Logistic map: xn+1=rxn(1−xn){\displaystyle x_{n+1}=rx_{n}(1-x_{n})\,} The horizontal axis is the r parameter, the vertical axis is the x variable. The image was created by forming a 1601 x 1001 array representing increments of 0.001 in r and x. A starting value of x=0.25 was used, and the map was iterated 1000 times in order to stabilize the values of x. 100,000 x -values were then calculated for each value of r and for each x value, the corresponding (x,r) pixel in the image was incremented by one. All values in a column (corresponding to a particular value of r) were then multiplied by the number of non-zero pixels in that column, in order to even out the intensities. Values above 250,000 were set to 250,000, and then the entire image was normalized to 0-255. Finally, pixels for values of r below 3.57 were darkened to increase visibility.
Title: LogisticMap BifurcationDiagram
Credit: Own work
Author: PAR
Usage Terms: Public domain
License: Public domain
Attribution Required?: No
Image usage
The following 2 pages link to this image:
