
Image: M2andInflation

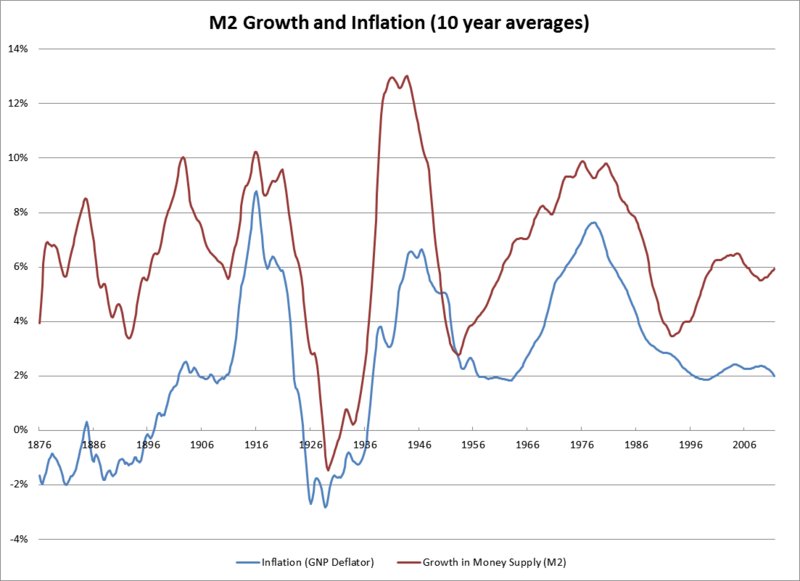
Description: Chart of M2 money supply growth and inflation as measured by the GNP price deflator. Data from 1875 to 1959 are taken from Appendix B of The American Business Cycle: Continuity and Change (edited by Robert Gordon). Data available here: http://www.nber.org/data/abc/. Data from 1959 onward are taken from the Fred database. Series IDs GNPDEF and MSNS. See for similar charts: http://research.stlouisfed.org/publications/review/98/11/9811wd.pdf and https://www.clevelandfed.org/Research/Commentary/1999/0801.pdf
Title: M2andInflation
Credit: Own work
Author: Bkwillwm
Usage Terms: Creative Commons Attribution-Share Alike 3.0
License: CC BY-SA 3.0
License Link: http://creativecommons.org/licenses/by-sa/3.0
Attribution Required?: Yes
Image usage
The following page links to this image:
