
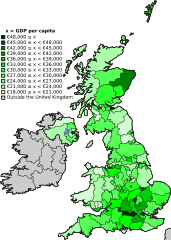
Image: Map of GDP per capita in the UK in 2007 (NUTS 3)

Description: A map of the United Kingdom (including Ireland and part of France) divided by NUTS level 3 areas. NUTS 3 areas loosely follow the administrative geography of the UK. The NUTS 3 areas are shaded green according to their GDP per capita in 2007 at current market prices in euros; darker green denotes higher GDP per capita and lighter green, lower GDP per capita.
Title: Map of GDP per capita in the UK in 2007 (NUTS 3)
Credit: File:NUTS 3 regions EU-27.svg for the map. http://epp.eurostat.ec.europa.eu/portal/page/portal/gisco/maps_posters/maps for guidance on the map. Gross domestic product (GDP) at current market prices at NUTS level 3 for the data
Author: CGN2010 for the original map. Jolly Janner for the GDP per capita shading and work on original map. Eurostat for the guidance on the original map and the 2007 GDP per capita data.
Permission: This file is licensed under the Creative Commons Attribution-Share Alike 2.5 Generic license. You are free: to share – to copy, distribute and transmit the work to remix – to adapt the work Under the following conditions: attribution – You must attribute the work in the manner specified by the author or licensor (but not in any way that suggests that they endorse you or your use of the work). share alike – If you alter, transform, or build upon this work, you may distribute the resulting work only under the same or similar license to this one. http://creativecommons.org/licenses/by-sa/2.5 CC BY-SA 2.5 Creative Commons Attribution-Share Alike 2.5 truetrue
Usage Terms: Creative Commons Attribution-Share Alike 2.5
License: CC BY-SA 2.5
License Link: http://creativecommons.org/licenses/by-sa/2.5
Attribution Required?: Yes
Image usage
The following page links to this image:

.svg)