
Image: Nightingale-mortality
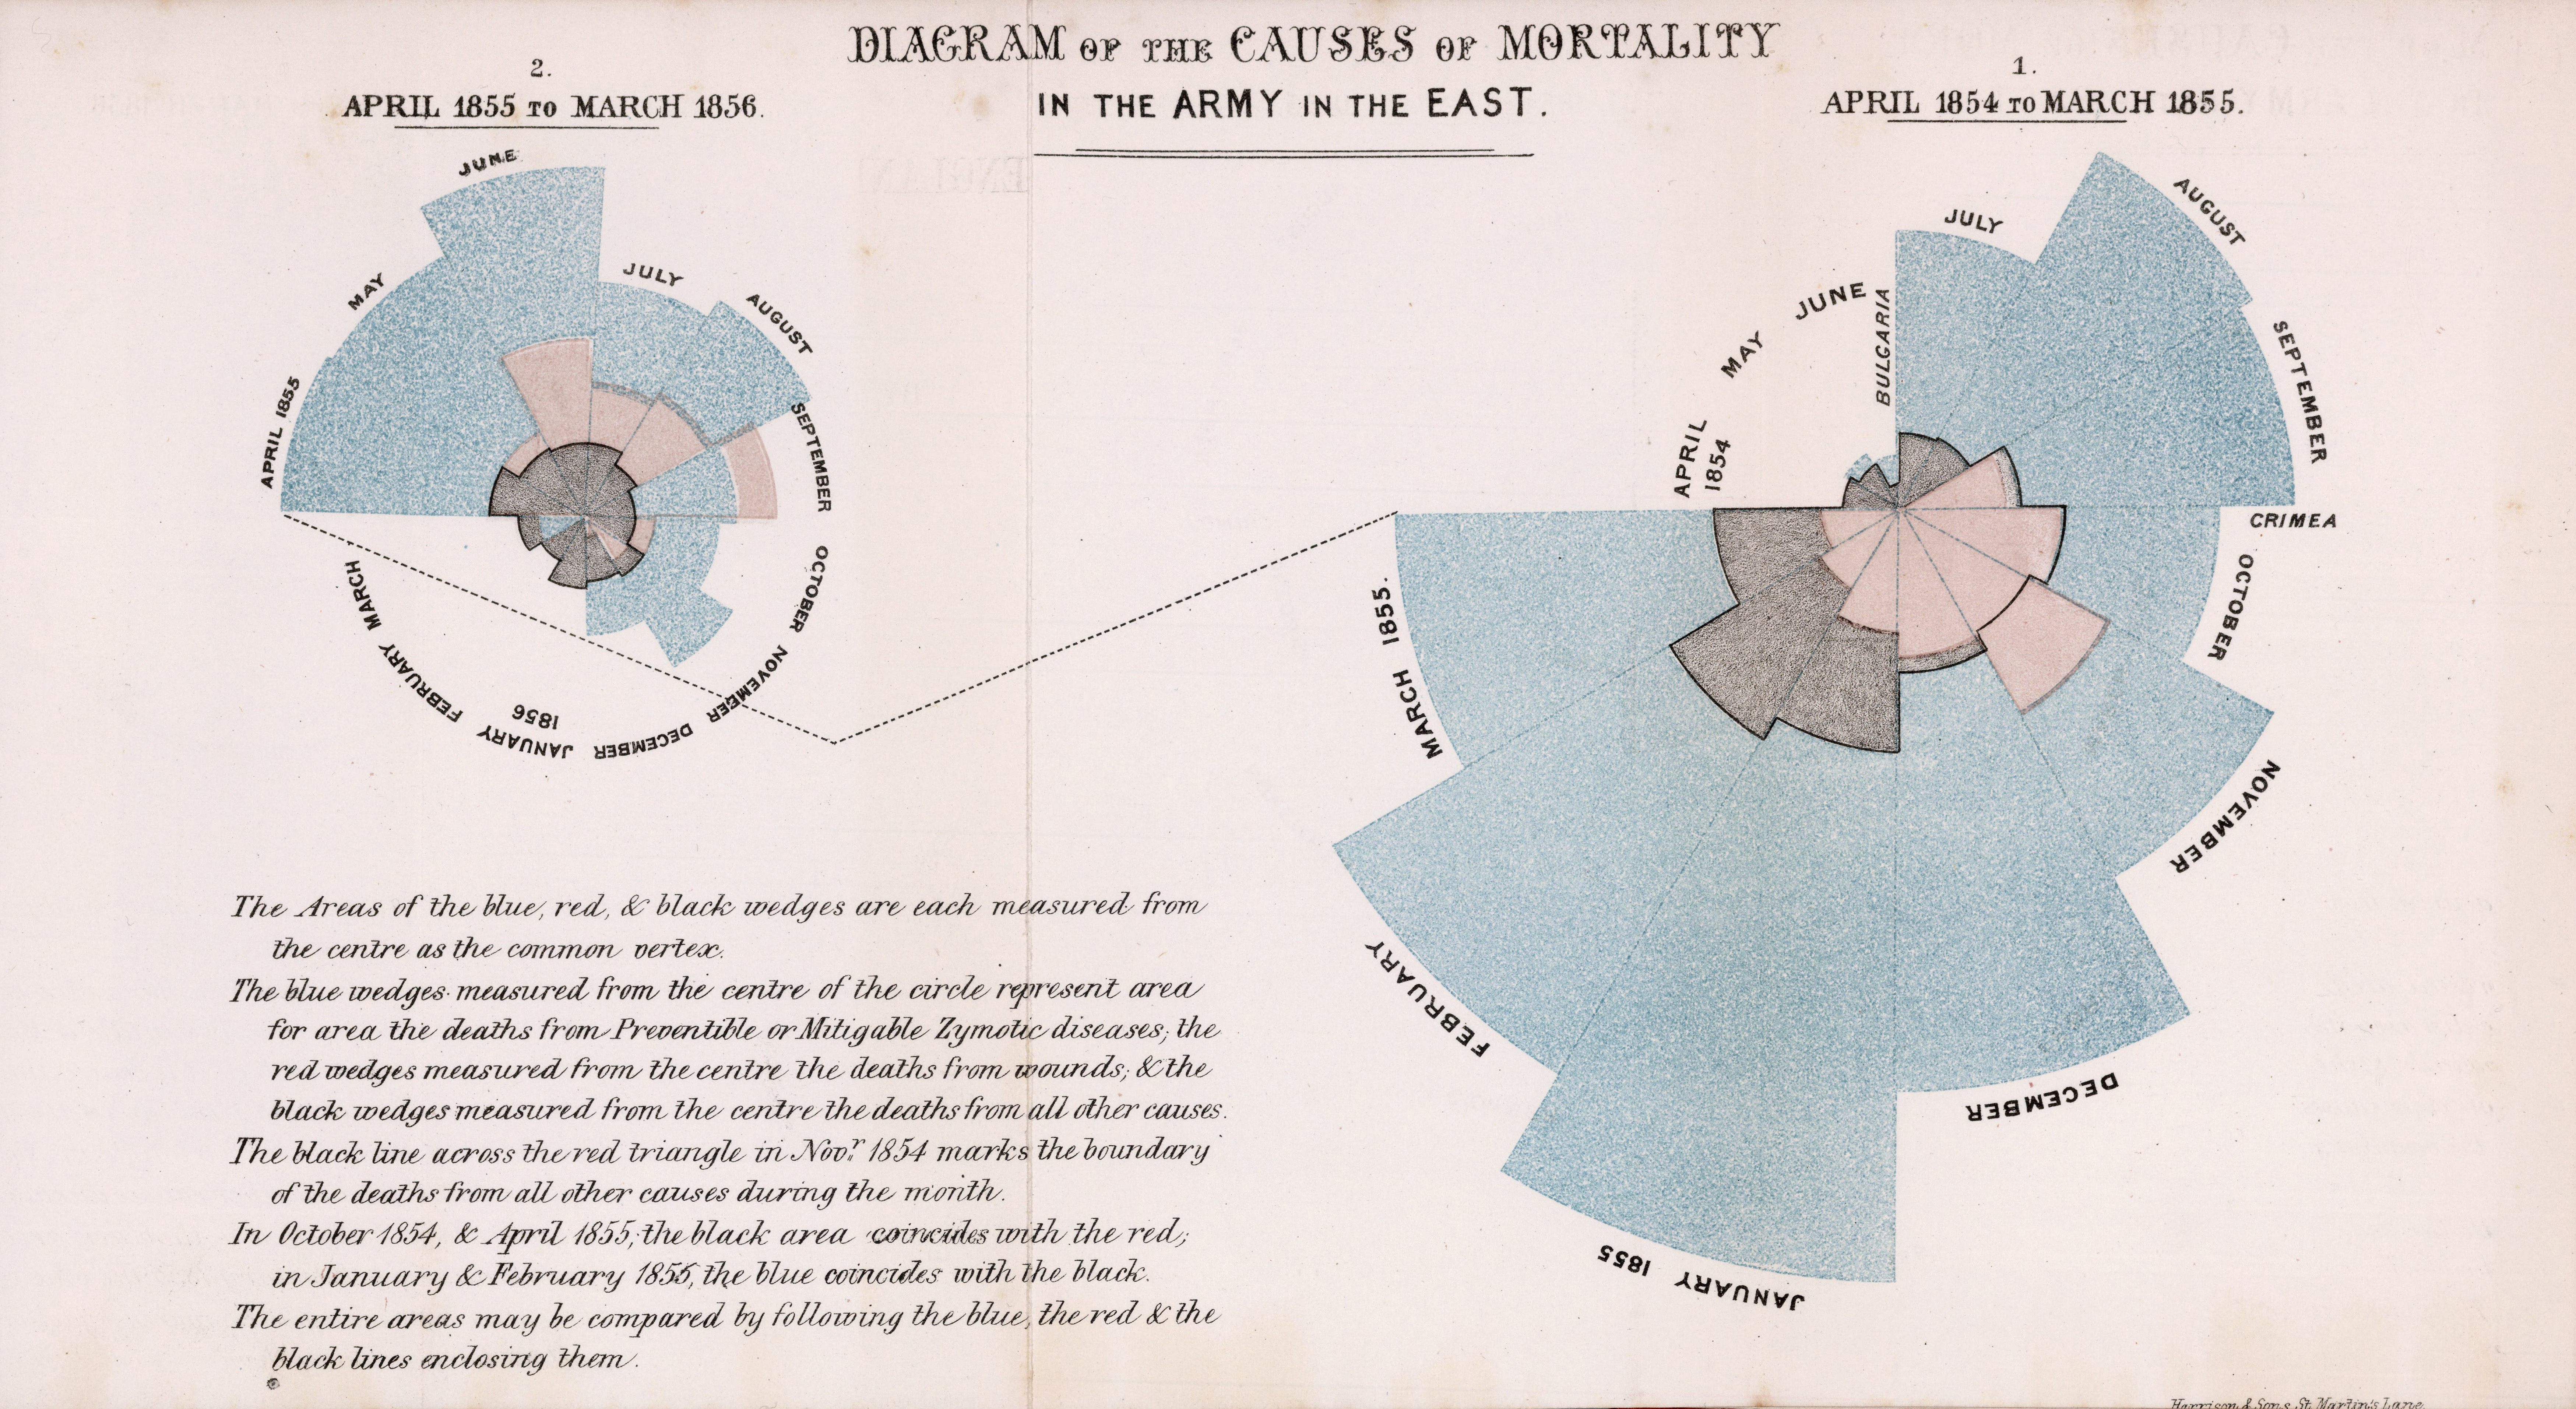
Description: Example of polar area diagram by w:Florence Nightingale (1820–1910). This "Diagram of the causes of mortality in the army in the East" was published in Notes on Matters Affecting the Health, Efficiency, and Hospital Administration of the British Army and sent to Queen Victoria in 1858. This graphic indicates the number of deaths that occured from preventable diseases (in blue), those that were the results of wounds (in red), and those due to other causes (in black). The legend reads: The Areas of the blue, red, & black wedges are each measured from the centre as the common vertex. The blue wedges measured from the centre of the circle represent area for area the deaths from Preventable or Mitigable Zymotic diseases, the red wedges measured from the centre the deaths from wounds, & the black wedges measured from the centre the deaths from all other causes. The black line across the red triangle in Nov. 1854 marks the boundary of the deaths from all other causes during the month. In October 1854, & April 1855, the black area coincides with the red, in January & February 1856, the blue coincides with the black. The entire areas may be compared by following the blue, the red, & the black lines enclosing them.
Title: Nightingale-mortality
Credit: http://www.royal.gov.uk/output/Page3943.asp [dead link]
Author: w:Florence Nightingale (1820–1910).
Usage Terms: Public domain
License: Public domain
Attribution Required?: No
Image usage
The following 6 pages link to this image:
