
Image: North-Carolina-Population-Change-2000-to-2008
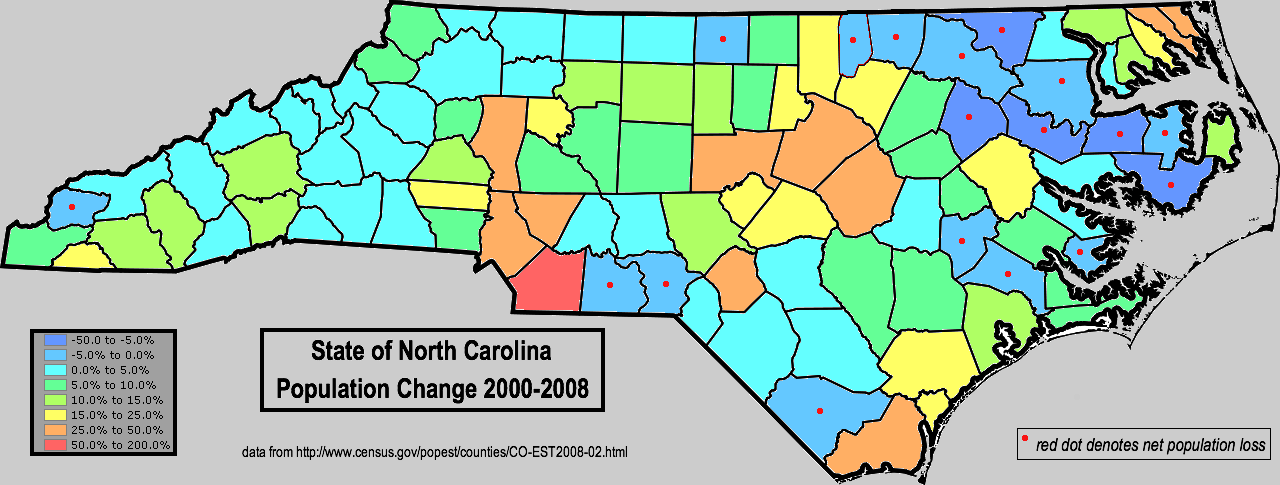
Description: Map of North Carolina, using color shading to denote net county-level population change from the 2000 thru 2008 period (2008 population estimates vs. 2000 census values). Data retrieved from http://www.census.gov/popest/counties/CO-EST2008-02.html Note the large-scale area of net population loss in the inland northeastern part of the state; these counties are all related to each other in that they contain the highest percentage of blacks, according to the Census 2000 data. [1]
Title: North-Carolina-Population-Change-2000-to-2008
Credit: I created this work entirely by myself. FWIW, though I live in Alabama now, I grew up in Vance County N.C.
Author: Nuberger13 (talk)
Usage Terms: Public domain
License: Public domain
Attribution Required?: No
Image usage
The following page links to this image:
