
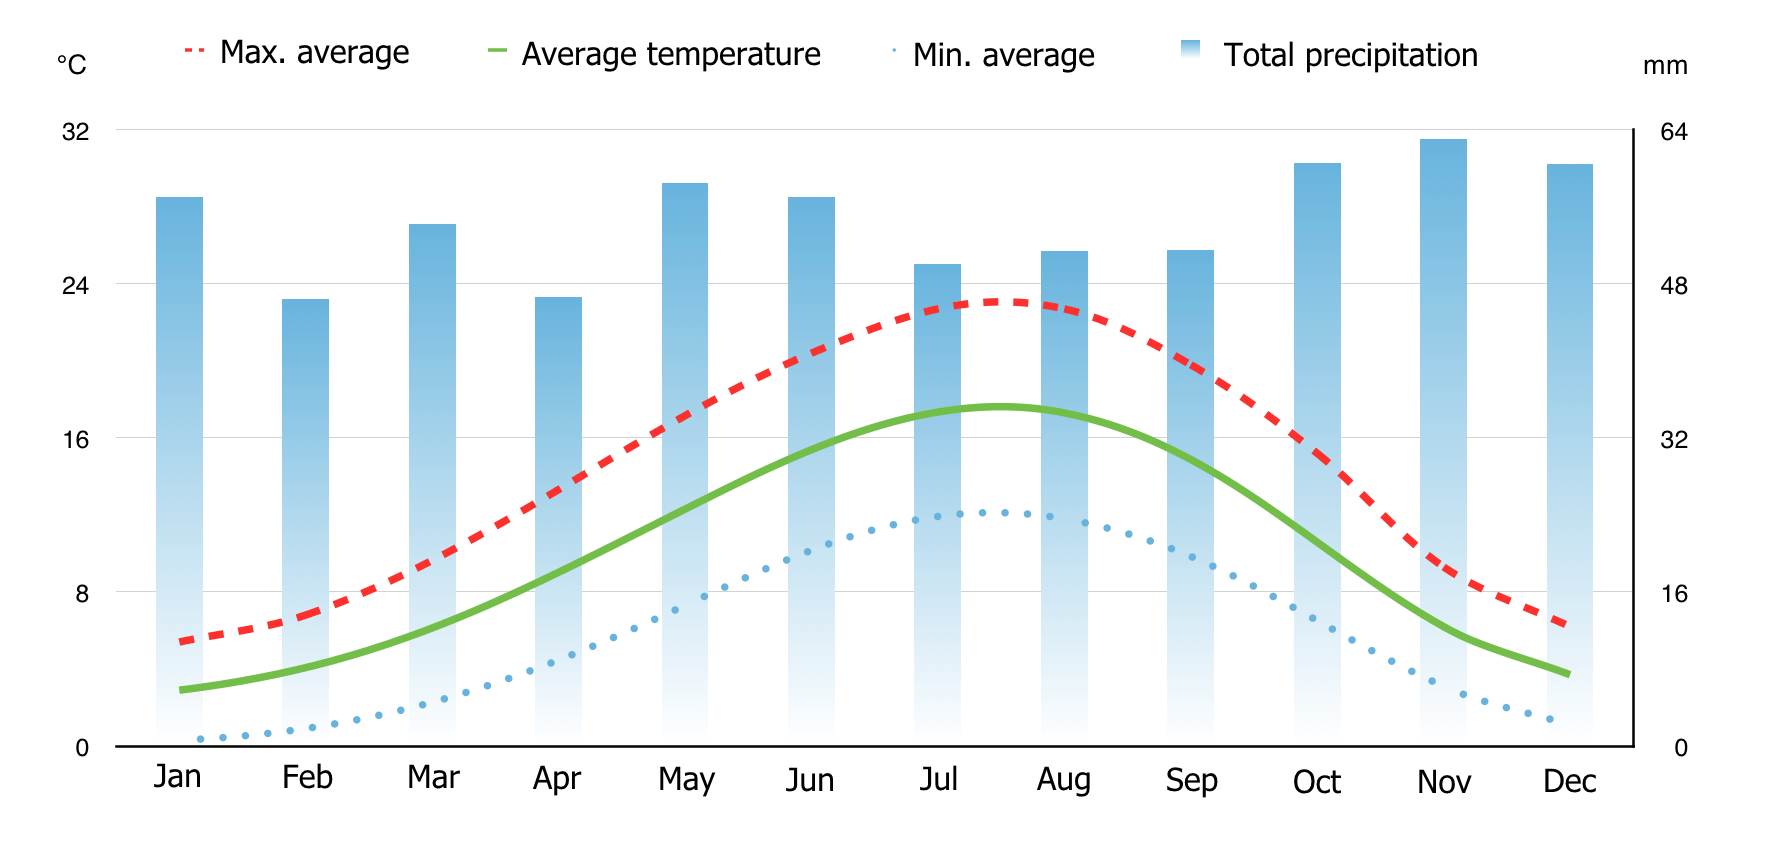
Image: Ombrothermic diagram of Amiens
Size of this preview: 800 × 382 pixels. Other resolutions: 320 × 153 pixels | 1,786 × 852 pixels.
Original image (1,786 × 852 pixels, file size: 185 KB, MIME type: image/png)
Description: Diagram showing the evolution of the average low, high and global temperatures of Amiens, as well as the precipitation bars. Averages calculated from the last 15 years of collected data from the station of Beauvais and Albert (data available on the "infoclimat" website
Title: Ombrothermic diagram of Amiens
Credit: This file was derived from: Diagramme ombrothermique d'Amiens.png Adapted for English use by EP111.
Author: MatthewThomas80000 Derivative: EP111
Usage Terms: Creative Commons Attribution-Share Alike 4.0
License: CC BY-SA 4.0
License Link: http://creativecommons.org/licenses/by-sa/4.0
Attribution Required?: Yes
Image usage
The following page links to this image:

All content from Kiddle encyclopedia articles (including the article images and facts) can be freely used under Attribution-ShareAlike license, unless stated otherwise.