
Image: Oxygenation-atm-2

Size of this PNG preview of this SVG file: 800 × 390 pixels. Other resolution: 320 × 156 pixels.
Original image (SVG file, nominally 840 × 410 pixels, file size: 24 KB)
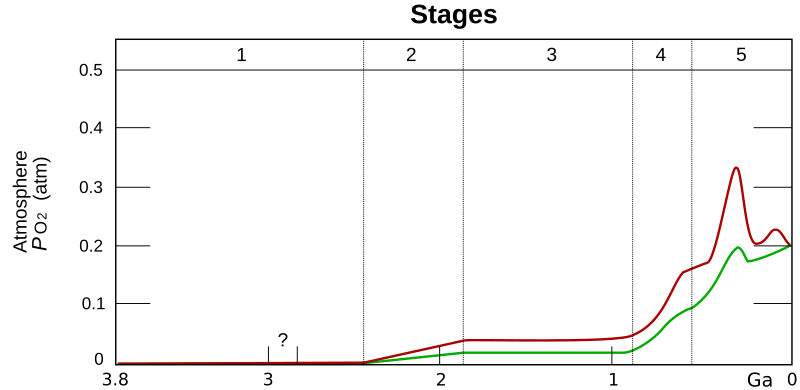
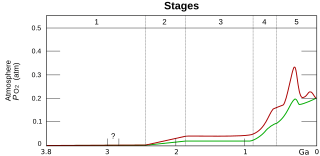
Description: Estimated evolution of atmospheric PO2{\displaystyle P_{O_{2}}}. The upper red and lower green lines represent the range of the estimates. The stages are: stage 1 (3.85–2.45Gyr ago (Ga)), stage 2 (2.45–1.85Ga), stage 3 (1.85–0.85Ga), Stage 4 (0.85–0.54Ga )and stage 5 (0.54Ga–present)
Title: Oxygenation-atm-2
Credit: Oxygenation-atm.svg
Author: Oxygenation-atm.svg: Heinrich D. Holland derivative work: Loudubewe (talk)
Usage Terms: Creative Commons Attribution-Share Alike 3.0
License: CC-BY-SA-3.0
License Link: http://creativecommons.org/licenses/by-sa/3.0/
Attribution Required?: Yes
Image usage
The following 3 pages link to this image:

All content from Kiddle encyclopedia articles (including the article images and facts) can be freely used under Attribution-ShareAlike license, unless stated otherwise.