
Image: Plot arctic sea ice volume

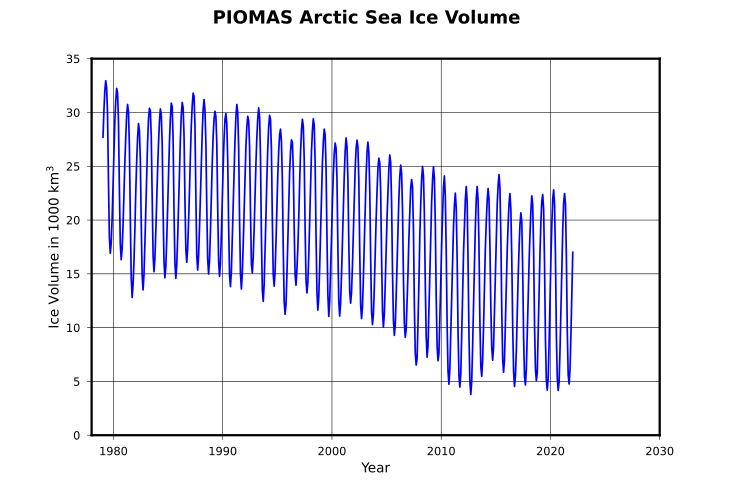
Description: Plot of estimated development of arctic sea ice volume between 1979 and now. Blue curve are data as determined by the numerical model PIOMAS. An error margin of +- 1.35 10³ km³ is given for october single values (minima) as orientation.
Title: Plot arctic sea ice volume
Credit: Template:Volume time series and uncertainties: Schweiger, A., R. Lindsay, J. Zhang, M. Steele, H. Stern, Uncertainty in modeled arctic sea ice volume, J. Geophys. Res., doi:10.1029/2011JC007084, 2011, Plot: own work, done with Gnumeric, based on published data of Polar Science Center, University of Washington, http://psc.apl.washington.edu/research/projects/arctic-sea-ice-volume-anomaly/data/
Author: Dominiklenne
Usage Terms: Public domain
License: Public domain
Attribution Required?: No
Image usage
The following page links to this image:
