
Image: Polar Bear Habitat
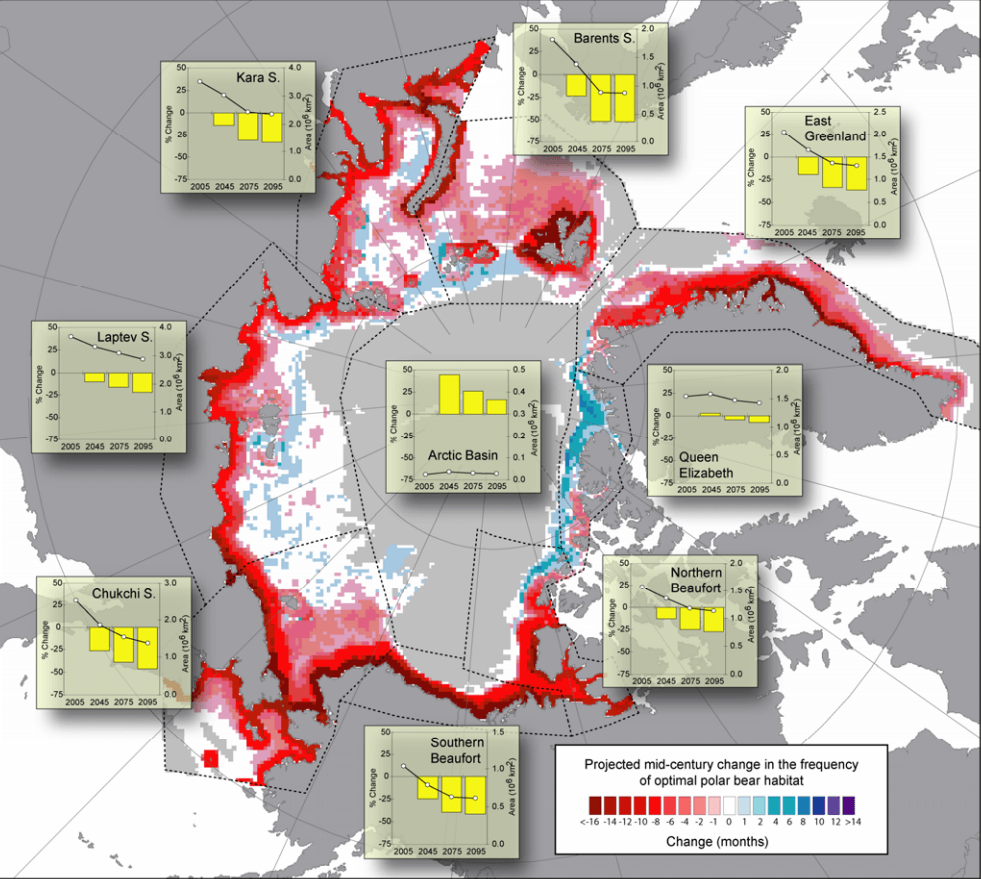
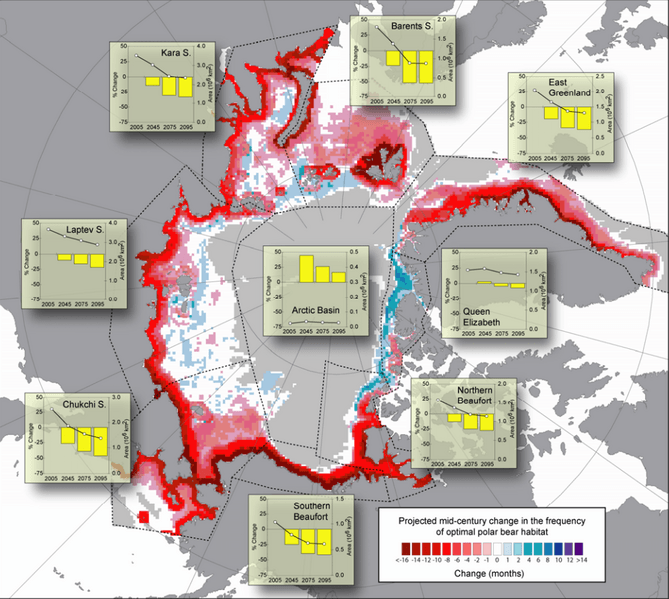
Description: Projected changes (based on 10 IPCC AR-4 GCM models run with the SRES- A1B forcing scenario) in the spatial distribution and integrated annual area of optimal polar bear habitat. Base map shows the cumulative number of months per decade where optimal polar bear habitat was either lost (red) or gained (blue) from 2001–2010 to 2041–2050. Offshore gray shading denotes areas where optimal habitat was absent in both periods. Insets show the average annual ( 12 months) cumulative area of optimal habitat (right y-axis, line plot) for four 10-year periods in the 21st century (x-axis midpoints), and their associated percent change in area (left y axis, histograms) relative to the first decade (2001–2010).
Title: Polar Bear Habitat
Credit: Predicting The Future Distribution of Polar Bear Habitat in the Polar Basin from Resource Selection Functions Applied to 21st Century General Circulation Model Projections of Sea Ice
Author: USGS
Usage Terms: Public domain
License: Public domain
Attribution Required?: No
Image usage
The following page links to this image:
