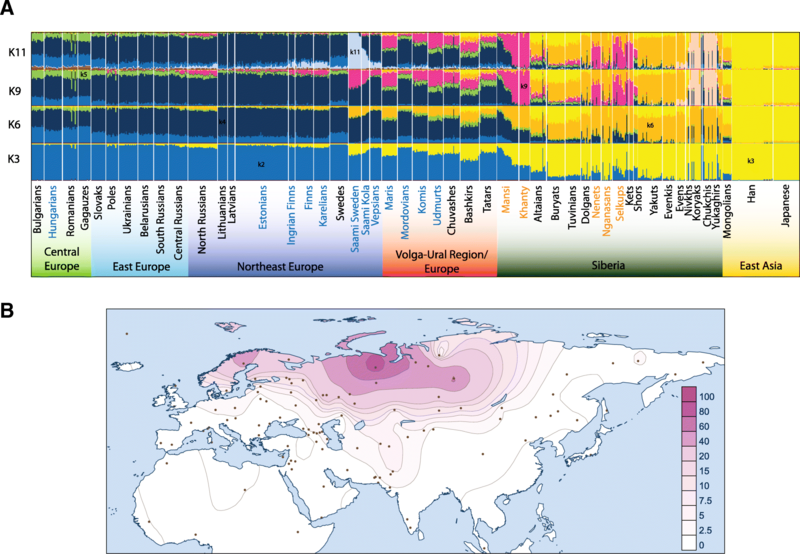
Image: Population structure of Uralic-speaking populations

Description: Population structure of Uralic-speaking populations inferred from ADMIXTURE analysis on autosomal SNPs in Eurasian context. a Individual ancestry estimates for populations of interest for selected number of assumed ancestral populations (K3, K6, K9, K11). Ancestry components discussed in a main text (k2, k3, k5, k6, k9, k11) are indicated and have the same colours throughout. The names of the Uralic-speaking populations are indicated with blue (Finno-Ugric) or orange (Samoyedic). The full bar plot is presented in Additional file 3: Figure S3. b Frequency map of component k9.
Title: Population structure of Uralic-speaking populations
Credit: Tambets, K., Yunusbayev, B., Hudjashov, G. et al. Genome Biol (2018) 19: 139. https://doi.org/10.1186/s13059-018-1522-1
Author: Tambets K, Yunusbayev B, Hudjashov G, Ilumäe AM, Rootsi S, Honkola T, Vesakoski O, Atkinson Q, Skoglund P, Kushniarevich A, Litvinov S, Reidla M, Metspalu E, Saag L, Rantanen T, Karmin M, Parik J, Zhadanov SI, Gubina M, Damba LD, Bermisheva M, Reisberg T, Dibirova K, Evseeva I, Nelis M, Klovins J, Metspalu A, Esko T, Balanovsky O, Balanovska E, Khusnutdinova EK, Osipova LP, Voevoda M, Villems R, Kivisild T, Metspalu M.
Usage Terms: Creative Commons Attribution 4.0
License: CC BY 4.0
License Link: https://creativecommons.org/licenses/by/4.0
Attribution Required?: Yes
Image usage
The following page links to this image:

