
Image: Positive consumption externality graph
Size of this preview: 800 × 528 pixels. Other resolutions: 320 × 211 pixels | 1,159 × 765 pixels.
Original image (1,159 × 765 pixels, file size: 25 KB, MIME type: image/png)
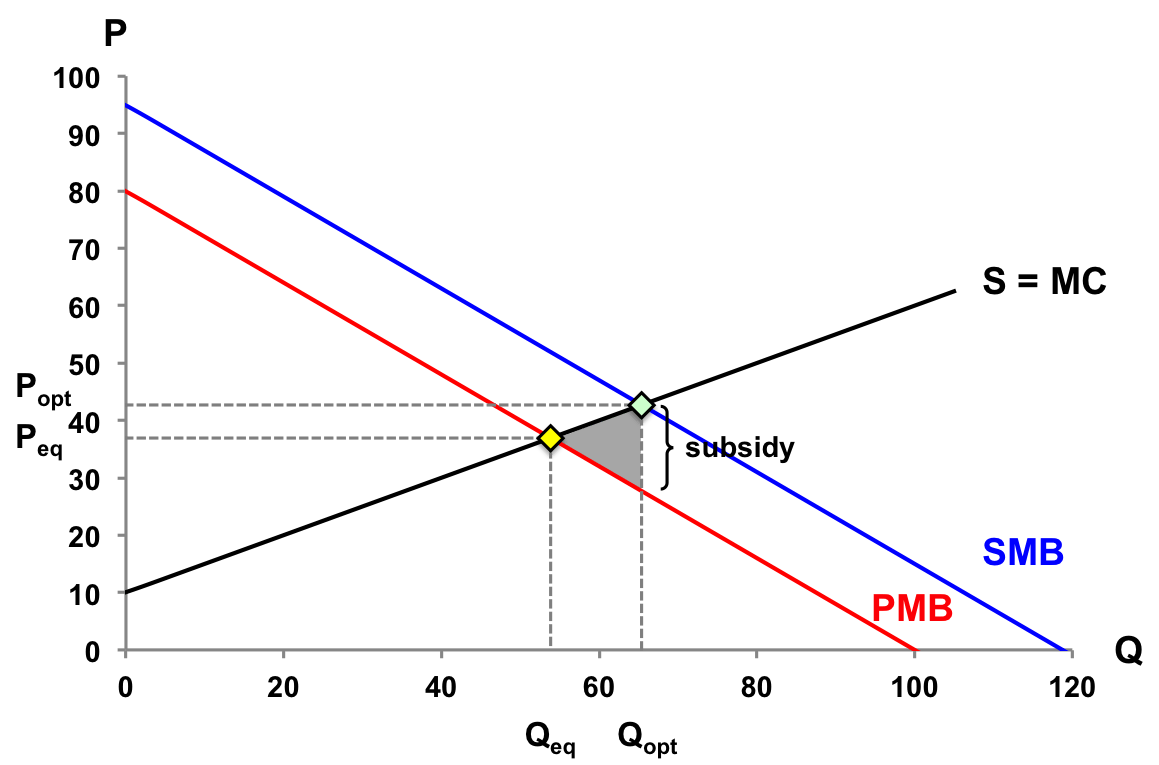
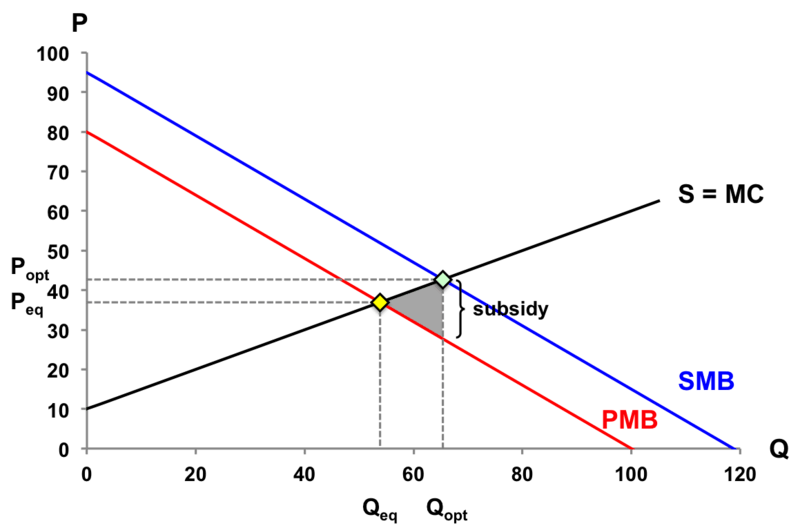
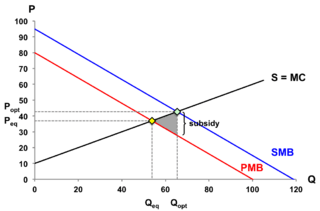
Description: Graph depicting a positive consumption externality with curves representing supply, private marginal benefit (private demand), and social marginal benefit (social demand). Equilibrium and optimal prices and quantities are marked, as well as the deadweight loss (gray triangle) and size of subsidy required to internalize the externality.
Title: Positive consumption externality graph
Credit: Own work
Author: Miraliu
Usage Terms: Creative Commons Attribution-Share Alike 4.0
License: CC BY-SA 4.0
License Link: https://creativecommons.org/licenses/by-sa/4.0
Attribution Required?: Yes
Image usage
The following page links to this image:

All content from Kiddle encyclopedia articles (including the article images and facts) can be freely used under Attribution-ShareAlike license, unless stated otherwise.