
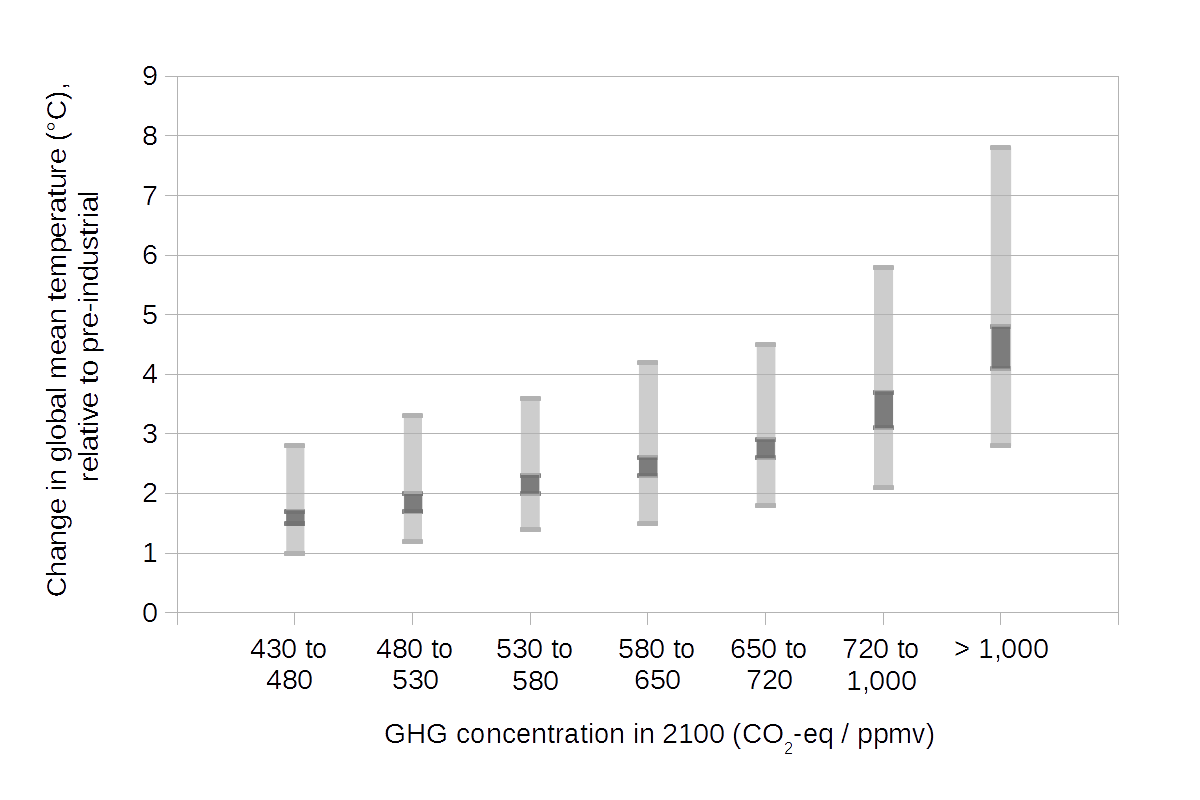
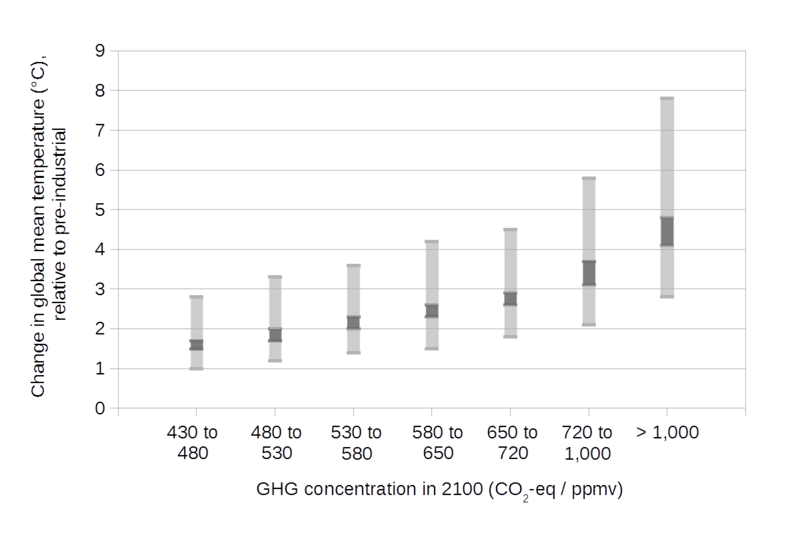
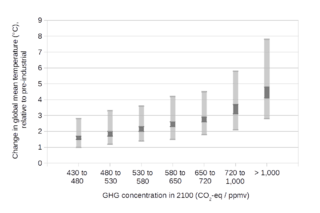
Image: Projected global warming in 2100 for a range of emission scenarios
Description: This graph shows projected increases in global mean temperature (relative to pre-industrial times) in the year 2100, for a range of scenarios. Pre-industrial times are approximated as the years 1850 to 1900. 7 sets of temperature projections are given for different atmospheric concentrations of greenhouse gases (measured in parts per million of carbon dioxide equivalents) in the year 2100. On the graph, the dark grey area of the bar shows 10th to 90th percentile range of median estimates, while the light grey area of the bar shows the 16th to 84th percentile range of the full distribution of results. Graph data is tabulated in a later section. References IPCC AR5 WG3; Edenhofer, O., et al., ed. (2014). Climate Change 2014: Mitigation of Climate Change. Contribution of Working Group III (WG3) to the Fifth Assessment Report (AR5) of the Intergovernmental Panel on Climate Change (IPCC). Cambridge University Press.. Archived 29 June 2014. Data are taken from Table SPM.1, in: Summary for Policymakers, p.13 (archived 29 June 2014). Explanation of the projections is given in Figure 6.13, in: Chapter 6: Assessing Transformation Pathways, p.34 (archived 29 June 2014).
Title: Projected global warming in 2100 for a range of emission scenarios
Credit: Own work
Author: Enescot
Usage Terms: Creative Commons Zero, Public Domain Dedication
License: CC0
License Link: http://creativecommons.org/publicdomain/zero/1.0/deed.en
Attribution Required?: No
Image usage
The following page links to this image:
