
Image: SNAP Benefits Paid 2005-2012

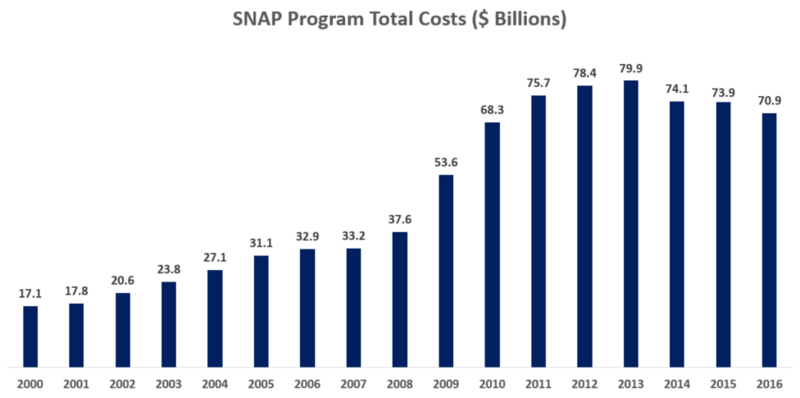
Description: SNAP Program Benefits Paid 2005-2012 Understanding the chart This chart indicates the amounts paid to recipients of the U.S. Supplemental Nutrition Assistance Program (SNAP), formerly referred to as Food Stamps. Data is available from the USDA website.[1] The compound annual growth rate was 19.7% from 2007 to 2012, calculated by author of the chart. The U.S. population grew about 1% annually on average during the period and participation increased 12% annually during the period.
Title: SNAP Benefits Paid 2005-2012
Credit: Chart created from USDA data
Author: Farcaster
Usage Terms: Creative Commons Attribution-Share Alike 3.0
License: CC BY-SA 3.0
License Link: http://creativecommons.org/licenses/by-sa/3.0
Attribution Required?: Yes
Image usage
The following page links to this image:
