
Image: Shifting Distribution of Summer Temperature Anomalies2
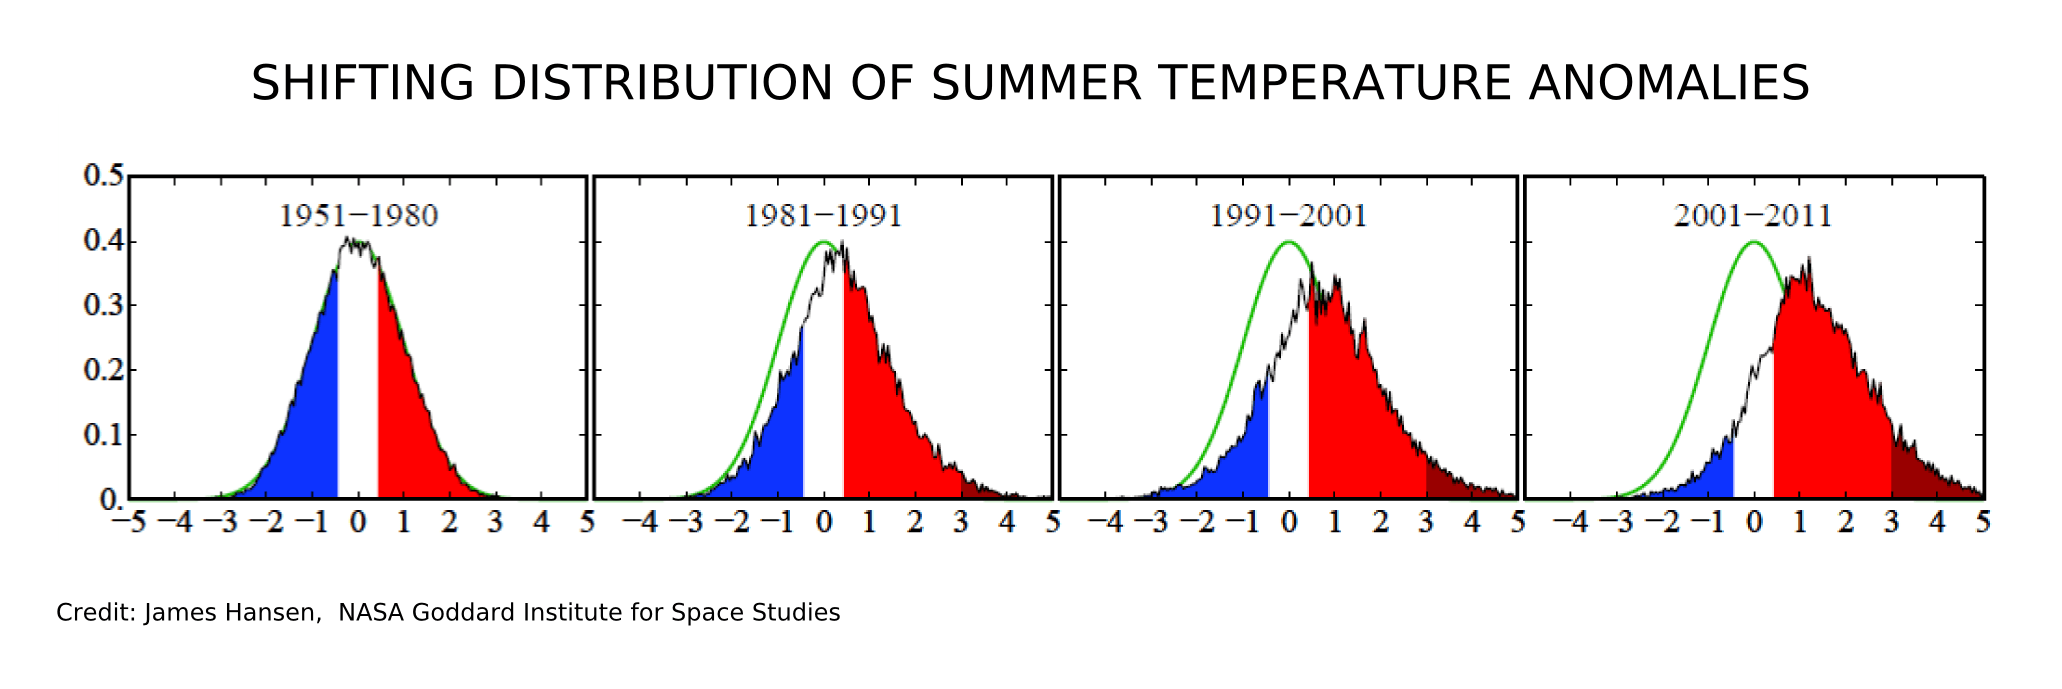
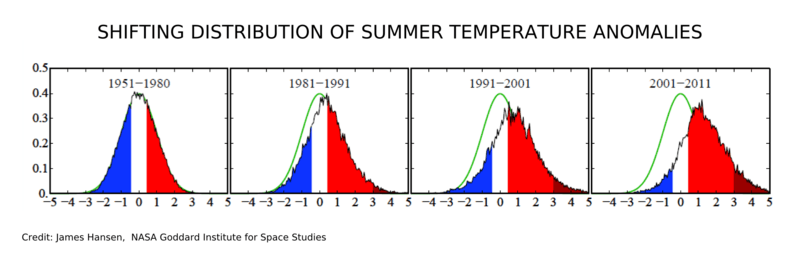
Description: Frequency of occurrence (vertical axis) of local June-July-August temperature anomalies (relative to 1951-1980 mean) for Northern Hemisphere land in units of local standard deviation (horizontal axis). Temperature anomalies in the period 1951-1980 match closely the normal distribution ("bell curve", shown in green), which is used to define cold (blue), typical (white) and hot (red) seasons, each with probability 33.3%. The distribution of anomalies has shifted to the right as a consequence of the global warming of the past three decades such that cool summers now cover only half of one side of a six-sided die, white covers one side, red
covers four sides, and an extremely hot (red-brown) anomaly covers half of one side..
Usage Terms: Public domain
Image usage
The following page links to this image:
