
Image: Solar-pv-prices-vs-cumulative-capacity
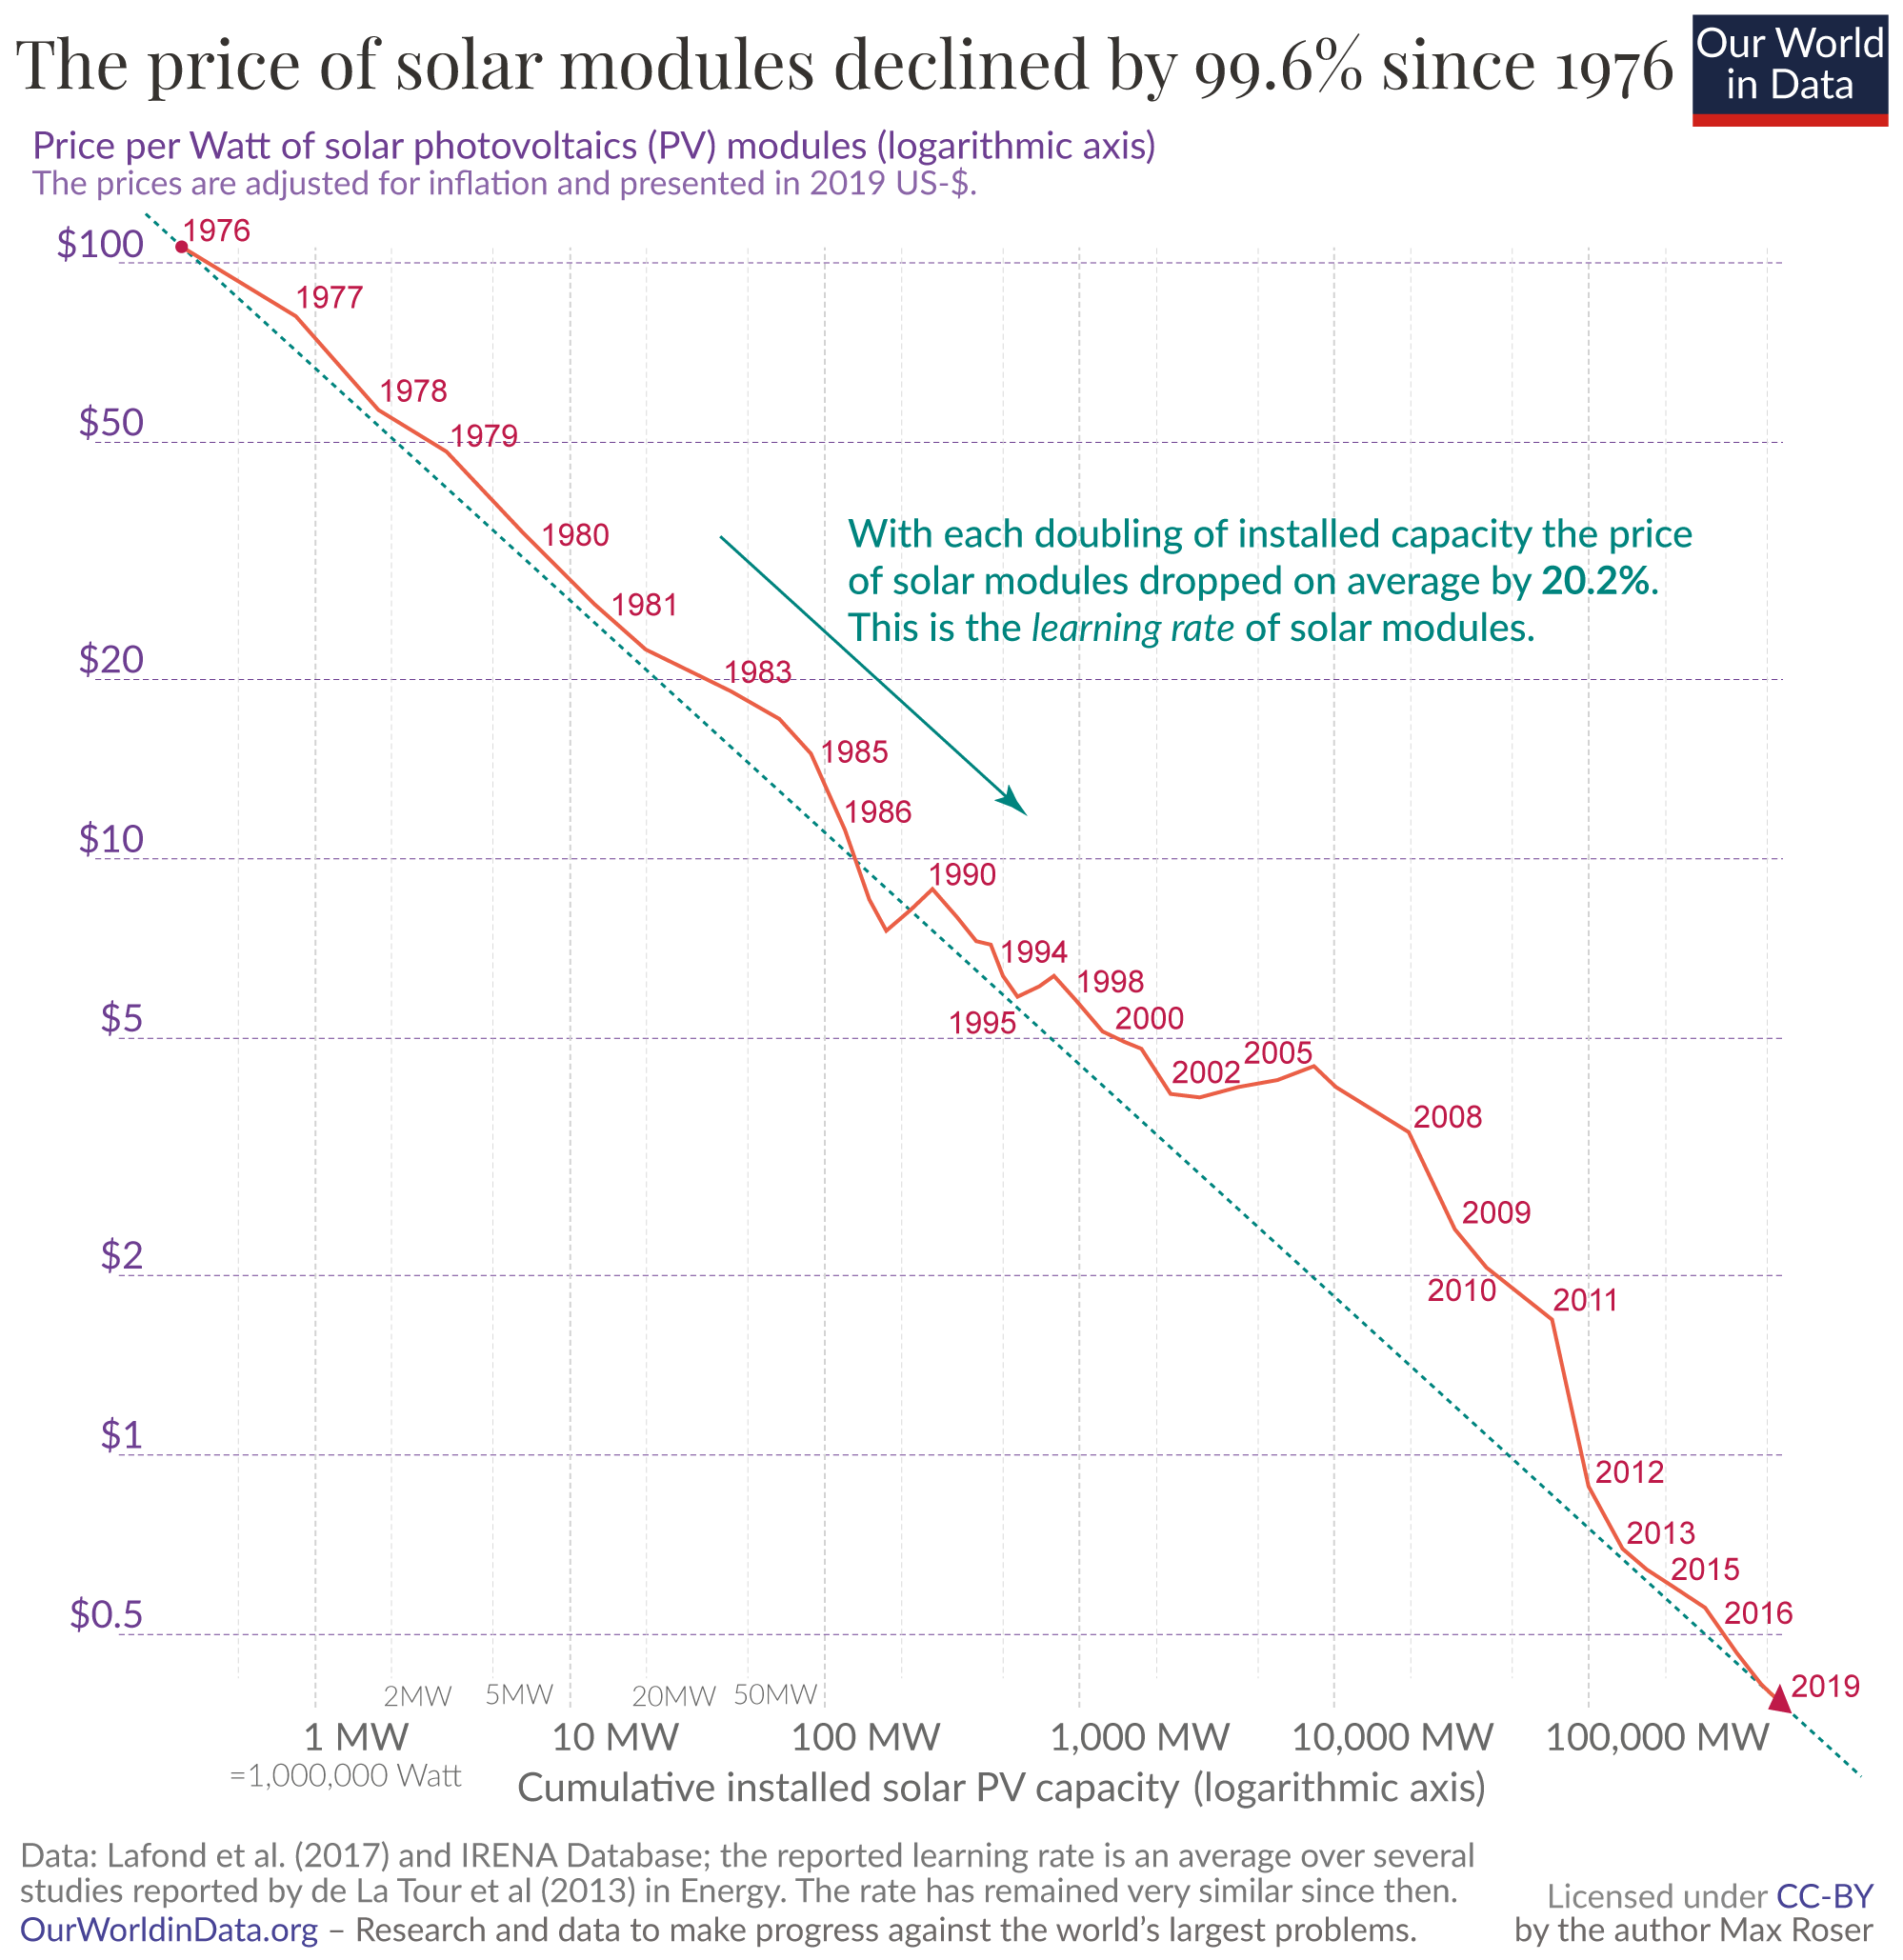
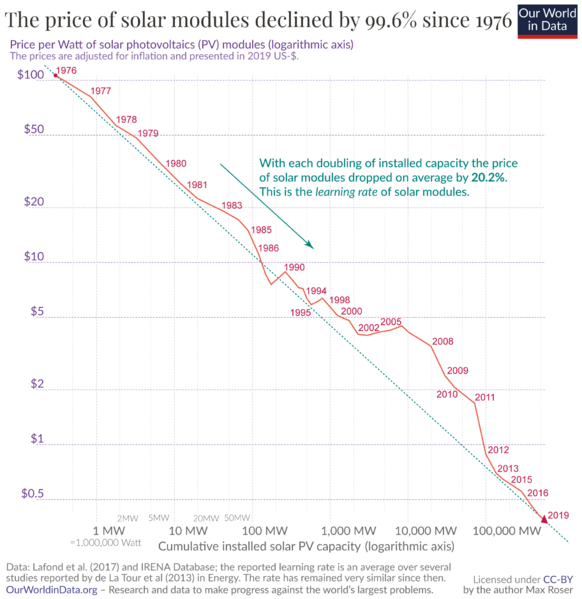
Description: A short history of solar: From outer space to the cheapest source of energy on earth During the 1960s the main application of solar remained in satellites. But the virtuous cycle was set in motion and this meant that slowly, but steadily, the price of solar modules declined. With falling prices the technology came down from space to our planet. The first terrestrial applications in the 1970s were in remote locations where the connection to the wider electrical grid is costly – lighthouses, remote railroad crossings, or the refrigeration of vaccines. The data point for 1976 in the top left corner of the chart shows the state of solar technology at the time. Back then the price of a solar module, adjusted for inflation, was US-$106 per watt. And as you see on the bottom axis, global installed solar PV capacity was only 0.3 megawatts. Relative to 1956 this was already a price decline of 94%, but relative to the world’s energy demand solar was still very expensive and therefore very small: a capacity of 0.3 megawatts is enough to provide electricity for about 20 people per year. The time-series in the chart shows how the price of solar modules changed from then until now. The so-called ‘learning effect’ in solar technology is incredibly strong: while the installed capacity increased exponentially, the price of solar modules declined exponentially. The fact that both metrics changed exponentially can be nicely seen in this chart because both axes are logarithmic. On a logarithmic axis a measure that declines exponentially follows a straight line. This straight line that represents the relationship between experience – measured as the cumulative installed capacity of the technology – and the price of that technology is called the learning curve of that technology. The relative price decline associated with each doubling of experience is the learning rate of a technology. This is the virtuous cycle in action. More deployment means falling prices, which means more deployment. With solar technology it was for a long time the case that its increased deployment was made possible through government subsidies and mandates – arguably the most positive effect of these policies is that they too drove down the price of these new technologies along the learning curve. Paying for renewables at a high price point earlier allows everyone to pay less for them later. That more production leads to falling prices is not surprising – such ‘economies of scale’ are found in many corners of manufacturing. If you are already making one pizza, it isn’t that much extra work to make a second one. What is truly mind blowing about solar technology is how very strong this effect is: For more than four decades each doubling of global cumulative capacity was associated with the same relative decline in prices. The advances that made this price reduction possible span the entire production process of solar modules:15 larger, more efficient factories are producing the modules; R&D efforts increase; technological advances increase the efficiency of the panels; engineering advances improve the production processes of the silicon ingots and wafers; the mining and processing of the raw materials increases in scale and becomes cheaper; operational experience accumulates; the modules are more durable and live longer; market competition ensures that profits are low; and capital costs for the production decline. It is a myriad of small improvements across a large collective process that drives this continuous price decline. The learning rate of solar PV modules is 20.2%.16 With each doubling of the installed cumulative capacity the price of solar modules declines by 20.2%.17 The high learning rate meant that the core technology of solar electricity declined rapidly. The price of solar modules declined from $106 to $0.38 per watt. A decline of 99.6%. To get our expectations for the future right we ought to pay a lot of attention to those technologies that follow learning curves. Initially we might only find them on a high-tech satellite out in space, but the future belongs to them. Renewable energy sources are not the only case; the most well-known case is the computer and the corresponding historical development there is ‘Moore’s Law’. If you are interested in getting your expectations about the future right, you are interested in how Moore’s Law helps us to see the future of technological development, and you want to know about whether it is indeed the case that scaled-up production causes declining prices you can read the following information box that takes a deeper look at it.
Title: Solar-pv-prices-vs-cumulative-capacity
Credit: https://ourworldindata.org/cheap-renewables-growth
Author: Our World In Data - Max Roser
Usage Terms: Creative Commons Attribution-Share Alike 4.0
License: CC BY-SA 4.0
License Link: https://creativecommons.org/licenses/by-sa/4.0
Attribution Required?: Yes
Image usage
The following page links to this image:
