
Image: South Africa dominant language map

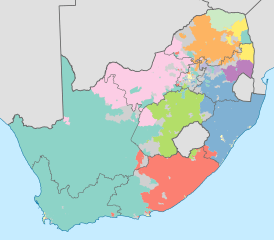
Description: Map showing the dominant home languages in South Africa, based on ward-level data from the 2011 census. In this context, a language is dominant if it more than 50% of the population in a ward speak it at home, or more than 33% speak it and no other language is spoken by more than 25%. English Afrikaans isiNdebele isiXhosa isiZulu Sesotho sa Leboa Sesotho Setswana siSwati Tshivenda Xitsonga No language dominant Projection is Albers Equal-Area Conic, with standard parallels at 25.5° S and 31.5° S, and origin at 28.5° S 24.5° E.
Title: South Africa 2011 dominant language map
Credit: Statistics South Africa's Census 2011 is the source of the basic population data. The map results from my own processing of the data. For ward boundaries see File:South Africa electoral wards 2011 blank.svg.
Author: Htonl
Usage Terms: Public domain
License: Public domain
Attribution Required?: No
Image usage
The following image is a duplicate of this image (more details):
The following page links to this image:
