
Image: Spectrumgstring
No higher resolution available.
Spectrumgstring.jpg (699 × 477 pixels, file size: 57 KB, MIME type: image/jpeg)
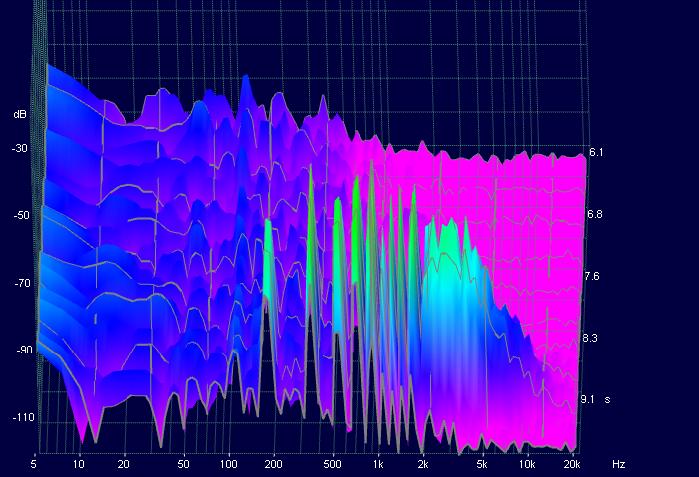
Description: A 3D sound spectrum analysis of a violin's G String using the OscilloMeter program. x=the frequency of pitch, y=the volume, and z=time. Observe the peaks at the foreground. The other low points are background noise. The interesting thing is that the pitch that we hear is the peak at around 200h, but the other peaks are overtones that contribute to the sound, greatly outnumbering the original pitch. You can make out the overtone series for the note G.
Title: Spectrumgstring
Credit: Own work
Author: Justoys
Usage Terms: Public domain
License: Public domain
Attribution Required?: No
Image usage
The following page links to this image:

All content from Kiddle encyclopedia articles (including the article images and facts) can be freely used under Attribution-ShareAlike license, unless stated otherwise.