
Image: U.S. Change in real income versus selected goods and services v1
Size of this preview: 800 × 600 pixels. Other resolutions: 320 × 240 pixels | 960 × 720 pixels.
Original image (960 × 720 pixels, file size: 11 KB, MIME type: image/png)
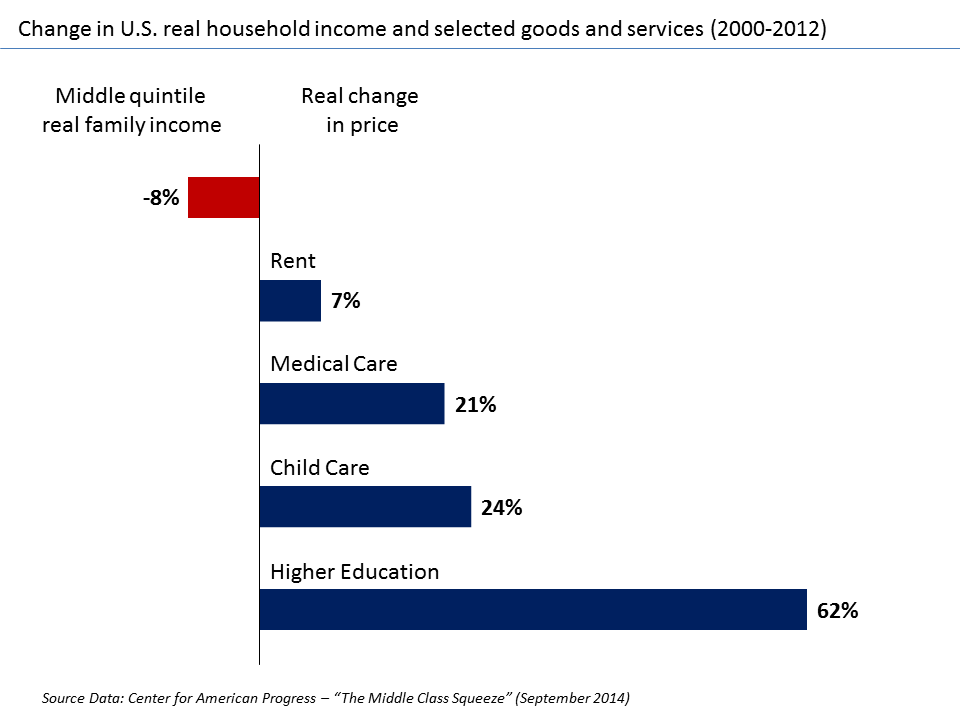
Description: The chart shows how real (i.e., inflation adjusted) median wages for the middle class family have fallen, while the real costs of goods and services have risen.
Title: U.S. Change in real income versus selected goods and services v1
Credit: Created using data from the Center for American Progress report "The Middle Class Squeeze"
Author: Farcaster
Usage Terms: Creative Commons Attribution-Share Alike 3.0
License: CC BY-SA 3.0
License Link: http://creativecommons.org/licenses/by-sa/3.0
Attribution Required?: Yes
Image usage
The following 3 pages link to this image:

All content from Kiddle encyclopedia articles (including the article images and facts) can be freely used under Attribution-ShareAlike license, unless stated otherwise.