
Image: U.S. GDP - Real vs. Potential Per CBO Forecasts of 2007 and 2016

Size of this preview: 800 × 365 pixels. Other resolutions: 320 × 146 pixels | 1,005 × 459 pixels.
Original image (1,005 × 459 pixels, file size: 21 KB, MIME type: image/png)
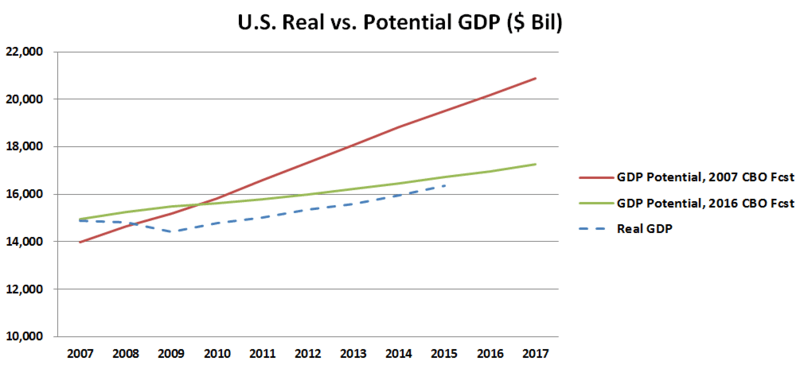
Description: This chart compares U.S. potential GDP under two CBO forecasts (one from 2007 and one from 2016) versus the actual real GDP. It is based on a similar diagram from economist Larry Summers from 2014.
Title: U.S. GDP - Real vs. Potential Per CBO Forecasts of 2007 and 2016
Credit: Own work
Author: Farcaster
Usage Terms: Creative Commons Attribution-Share Alike 4.0
License: CC BY-SA 4.0
License Link: https://creativecommons.org/licenses/by-sa/4.0
Attribution Required?: Yes
Image usage
The following page links to this image:

All content from Kiddle encyclopedia articles (including the article images and facts) can be freely used under Attribution-ShareAlike license, unless stated otherwise.