
Image: Vostok Petit data

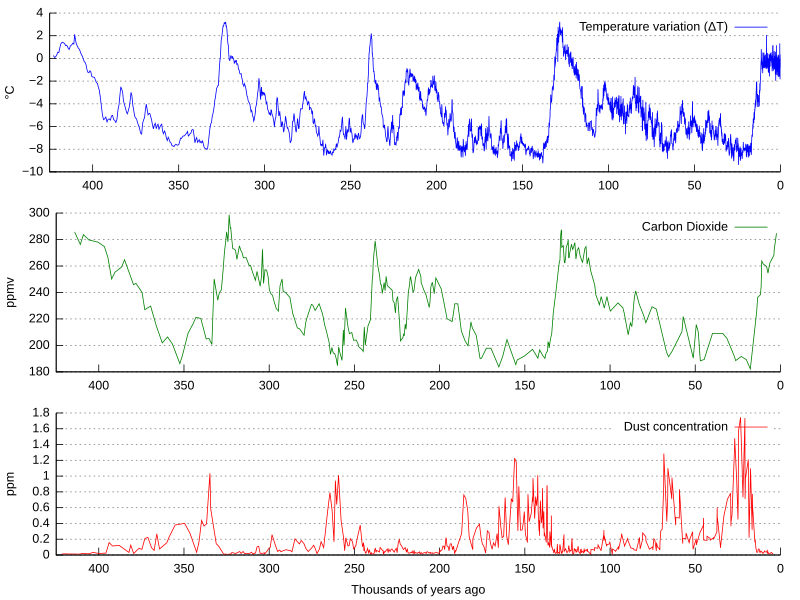
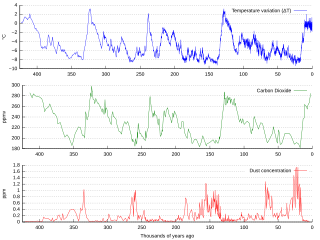
Description: La bildo estas kopiita de wikipedia:en. La originala priskribo estas: Graph of CO2 (Green graph), temperature (Blue graph), and dust concentration (Red graph) measured from the Vostok, Antarctica ice core as reported by Petit et al., 1999. Higher dust levels are believed to be caused by cold, dry periods. The Earth's orbital eccentricity, tilt, and precession vary in a pattern over thousands of years. The IPCC notes that Milankovitch cycles drove the ice age cycles; CO2 followed temperature change "with a lag of some hundreds of years" (visible on a graph more zoomed in than this); and that as a feedback amplified temperature change. Among other factors, CO2 is more soluble in colder than in warmer waters.
Title: Vostok Petit data
Credit: Vostok-ice-core-petit.png
Author: Vostok-ice-core-petit.png: NOAA derivative work: Autopilot (talk)
Usage Terms: Creative Commons Attribution-Share Alike 3.0
License: CC-BY-SA-3.0
License Link: http://creativecommons.org/licenses/by-sa/3.0/
Attribution Required?: Yes
Image usage
The following 4 pages link to this image:
