
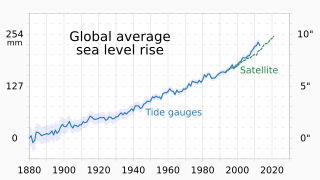
Image: 1880- Global average sea level rise (SLR) - annually

Description: Chart showing global average sea level rise (SLR), annually Data source: Climate Change Indicators: Sea Level / Figure 1. Absolute Sea Level Change. EPA.gov. U.S. Environmental Protection Agency (EPA) (July 2022). Archived from the original on 4 September 2023. "Data sources: CSIRO, 2017. NOAA, 2022." Source states: "This graph shows cumulative changes in sea level for the world’s oceans since 1880, based on a combination of long-term tide gauge measurements and recent satellite measurements. This figure shows average absolute sea level change, which refers to the height of the ocean surface, regardless of whether nearby land is rising or falling. Satellite data are based solely on measured sea level, while the long-term tide gauge data include a small correction factor because the size and shape of the oceans are changing slowly over time. (On average, the ocean floor has been gradually sinking since the last Ice Age peak, 20,000 years ago.) The shaded band shows the likely range of values, based on the number of measurements collected and the precision of the methods used." Technical note: most SVG code was automatically generated by the "Line charts" spreadsheet linked at User:RCraig09/Excel to XML for SVG. Additions and adjustments were made in a text editor.
This SVG file contains embedded text that can be translated into your language, using any capable SVG editor, text editor or the SVG Translate tool. For more information see: About translating SVG files.
Author: RCraig09
Usage Terms: Creative Commons Attribution-Share Alike 3.0
License: CC-BY-SA-3.0
License Link: http://creativecommons.org/licenses/by-sa/3.0/
Attribution Required?: Yes
Image usage
The following page links to this image:

_-_annually.svg)