
Image: 2000- Outcomes of active shooter attacks (stacked bar chart)

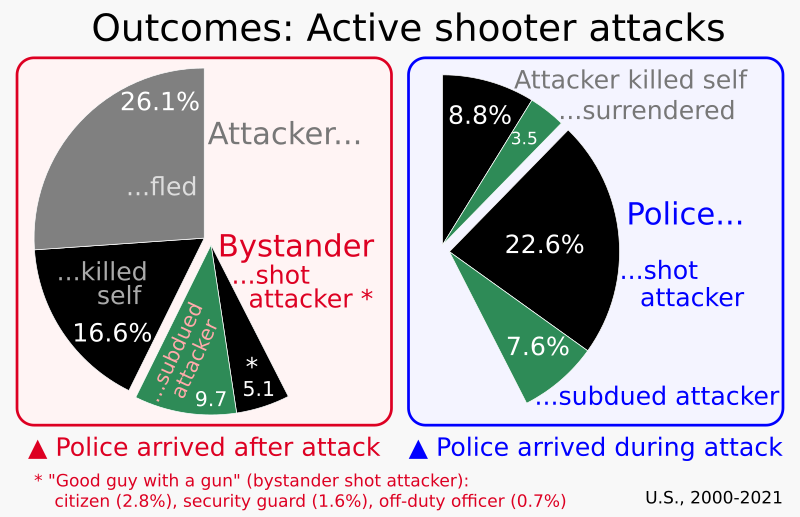
Description: Chart showing outcomes of active shooter attacks (U.S., 2000-). Suggested caption:A New York Times study reported how outcomes of active shooter attacks varied with actions of the attacker, the police (42% of total incidents), and bystanders (including a "good guy with a gun" outcome in 5.1% of total incidents).[cite]Source: Buchanan, Larry; Leatherby, Lauren (June 22, 2022). "Who Stops a ‘Bad Guy With a Gun’?". The New York Times. "Data source: Advanced Law Enforcement Rapid Response Training Center" Archive thereof: https://web.archive.org/web/20220622111531/https://www.nytimes.com/interactive/2022/06/22/us/shootings-police-response-uvalde-buffalo.html Image of front page of The New York Times (June 23, 2022): https://static01.nyt.com/images/2022/06/23/nytfrontpage/scan.pdf Archive thereof: https://web.archive.org/web/20220623194207/https://static01.nyt.com/images/2022/06/23/nytfrontpage/scan.pdf Technical note: most SVG code for Version 6 was automatically generated by the "pie charts" spreadsheet linked at User:RCraig09/Excel to XML for SVG. Minor additions and adjustments were made in a text editor. Versions 1-5 were manually created using text editor. This SVG file contains embedded text that can be translated into your language, using any capable SVG editor, text editor or the SVG Translate tool. For more information see: About translating SVG files.
Title: 2000- Outcomes of active shooter attacks (stacked bar chart)
Credit: Own work
Author: RCraig09
Usage Terms: Creative Commons Attribution-Share Alike 4.0
License: CC BY-SA 4.0
License Link: https://creativecommons.org/licenses/by-sa/4.0
Attribution Required?: Yes
Image usage
The following page links to this image:

.svg)