
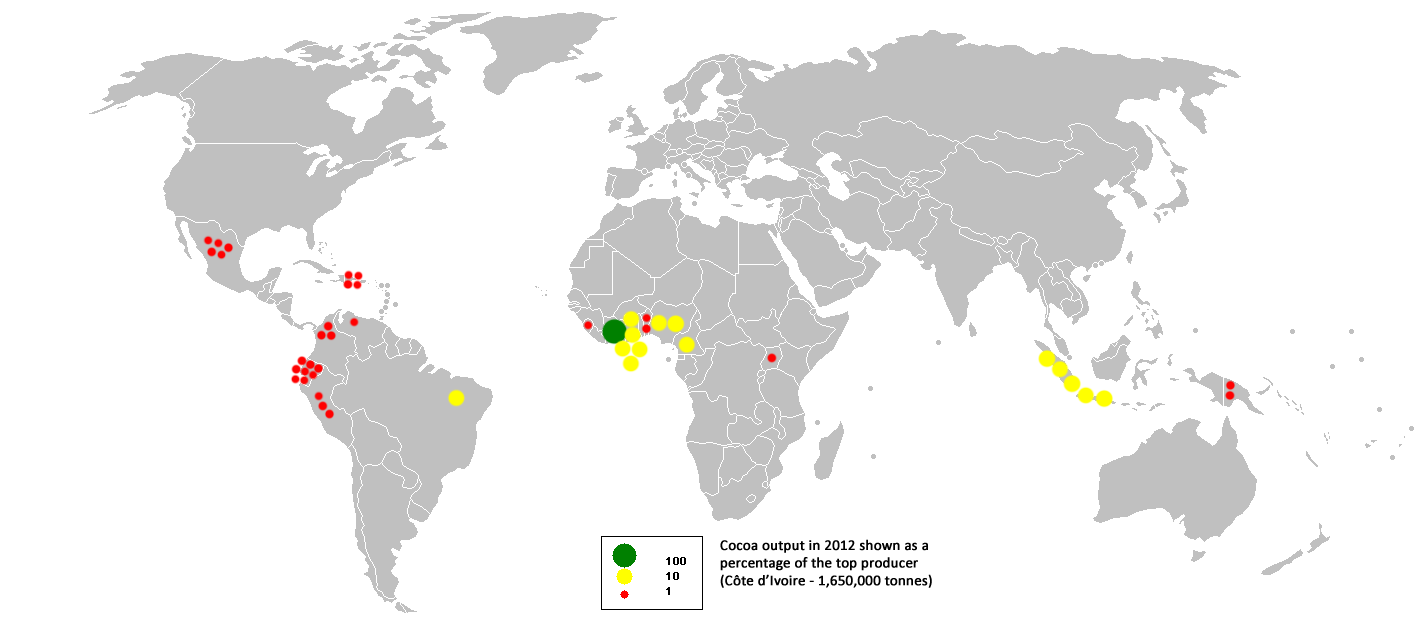
Image: 2012 cocoa bean output
Size of this preview: 800 × 351 pixels. Other resolutions: 320 × 140 pixels | 1,425 × 625 pixels.
Original image (1,425 × 625 pixels, file size: 26 KB, MIME type: image/png)
Description: This bubble map shows the global distribution of cocoa bean output in 2012 as a percentage of the top producer (Côte d'Ivoire - 1,650,000 tonnes). This map is consistent with incomplete set of data too as long as the top producer is known. It resolves the accessibility issues faced by colour-coded maps that may not be properly rendered in old computer screens. Data was extracted on 25th February 2015 from FAO.
Title: 2012 cocoa bean output
Credit: Own work
Author: Swidran
Usage Terms: Creative Commons Attribution-Share Alike 4.0
License: CC BY-SA 4.0
License Link: https://creativecommons.org/licenses/by-sa/4.0
Attribution Required?: Yes
Image usage
The following 2 pages link to this image:

All content from Kiddle encyclopedia articles (including the article images and facts) can be freely used under Attribution-ShareAlike license, unless stated otherwise.