
Image: 2019 Carbon dioxide emissions by income group - Oxfam data

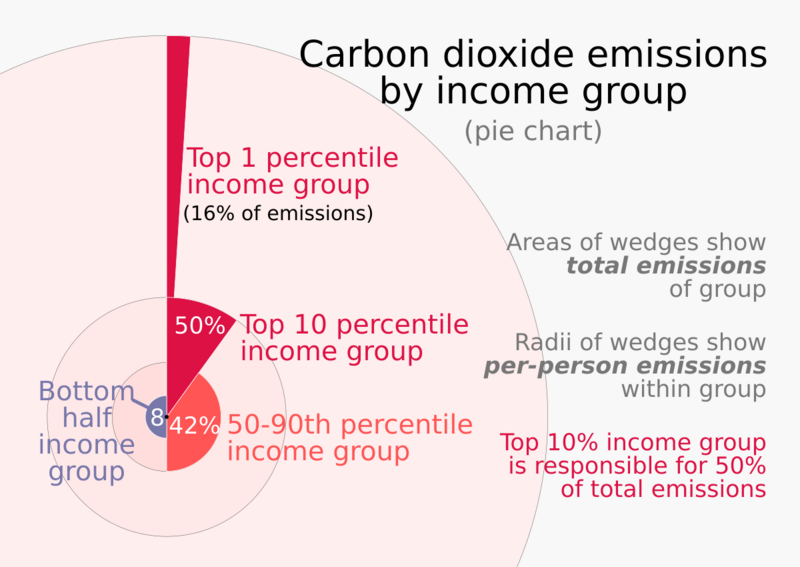
Description: Chart showing total and per-person carbon dioxide emissions by income group, based on data from Oxfam International Data source: (November 2023) Climate Equality: a Climate for the 99%, Oxfam International Fig. ES.2, Fig. ES.3, Box 1.2. — Archive thereof: https://web.archive.org/web/20231123191311/https://webassets.oxfamamerica.org/media/documents/cr-climate-equality-201123-en.pdf Technical note: most SVG code was automatically generated, wedge by wedge, by the "Pie charts" spreadsheet linked at User:RCraig09/Excel to XML for SVG. Wedges were manually combined in the file uploaded here. Additions and adjustments were made in a text editor. This SVG file contains embedded text that can be translated into your language, using any capable SVG editor, text editor or the SVG Translate tool. For more information see: About translating SVG files.
Title: 2019 Carbon dioxide emissions by income group - Oxfam data
Credit: Own work
Author: RCraig09
Usage Terms: Creative Commons Attribution-Share Alike 4.0
License: CC BY-SA 4.0
License Link: https://creativecommons.org/licenses/by-sa/4.0
Attribution Required?: Yes
Image usage
The following page links to this image:
