
Image: 20200314 Temperature changes for three latitude bands (5MA, 1880- ) GISS

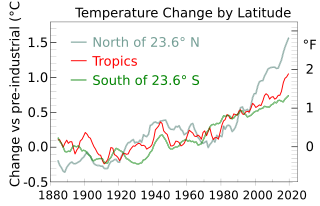
Description: Graphs of average temperature changes for three latitude bands, 1880- , 5-year smoothed. Data source: NASA Goddard Institute of Space Studies (GISS) "Annual Mean Temperature Change for Three Latitude Bands ▶" at https://data.giss.nasa.gov/gistemp/graphs_v4/ Data in .txt format: https://data.giss.nasa.gov/gistemp/graphs_v4/graph_data/Temperature_Change_for_Three_Latitude_Bands/graph.txt— Archive: https://web.archive.org/web/20200315170007/https://data.giss.nasa.gov/gistemp/graphs_v4/graph_data/Temperature_Change_for_Three_Latitude_Bands/graph.txt (or?) https://web.archive.org/web/20200315170008/https://data.giss.nasa.gov/gistemp/graphs_v4/graph_data/Temperature_Change_for_Three_Latitude_Bands/graph.txtDescription from source: "Annual and five-year lowess smoothed temperature changes, with the base period 1951-1980, for three latitude bands that cover 30%, 40% and 30% of the global area. Uncertainty bars (95% confidence limits) for the annual (outer) and five-year smooth (inner) are based on a spatial sampling analysis. These estimates use land and ocean data. [This is an update of Figure 5 in Hansen et al. (1999).]"
Title: 20200314 Temperature changes for three latitude bands (5MA, 1880- ) GISS
Credit: Own work
Author: RCraig09
Usage Terms: Creative Commons Attribution-Share Alike 4.0
License: CC BY-SA 4.0
License Link: https://creativecommons.org/licenses/by-sa/4.0
Attribution Required?: Yes
Image usage
The following page links to this image:

_GISS.svg)